Advertisement
Singapore markets closed
  • Straits Times Index

    3,176.51
    -11.15 (-0.35%)
     
  • Nikkei

    37,068.35
    -1,011.35 (-2.66%)
     
  • Hang Seng

    16,224.14
    -161.73 (-0.99%)
     
  • FTSE 100

    7,895.85
    +18.80 (+0.24%)
     
  • Bitcoin USD

    63,865.59
    +386.21 (+0.61%)
     
  • CMC Crypto 200

    1,381.26
    +68.64 (+5.23%)
     
  • S&P 500

    4,967.23
    -43.89 (-0.88%)
     
  • Dow

    37,986.40
    +211.02 (+0.56%)
     
  • Nasdaq

    15,282.01
    -319.49 (-2.05%)
     
  • Gold

    2,403.40
    +5.40 (+0.23%)
     
  • Crude Oil

    83.44
    +0.71 (+0.86%)
     
  • 10-Yr Bond

    4.6150
    -0.0320 (-0.69%)
     
  • FTSE Bursa Malaysia

    1,547.57
    +2.81 (+0.18%)
     
  • Jakarta Composite Index

    7,087.32
    -79.50 (-1.11%)
     
  • PSE Index

    6,443.00
    -80.19 (-1.23%)
     

USD/JPY Daily RSI at Highest Level all Year

DailyFX.com -

Daily

USD/JPY Daily RSI at Highest Level all Year

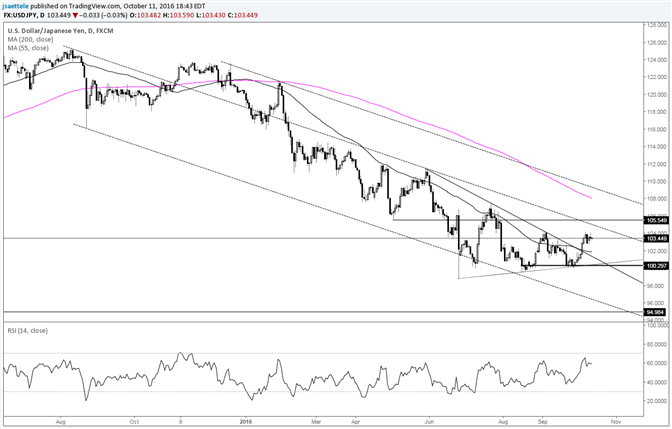
Chart Prepared by Jamie Saettele, CMT

DailyFX Trading Guides and Forecasts

-USD/JPY has broken through trendline resistance therefore focus is towards 105 as per the triangle interpretation. Specifically, be aware of the May low at 105.55. Previous comments regarding pattern remain valid. “Price action since the June low (Brexit) could end up as a triangle before another leg lower unfolds.”

For more analysis and trade setups (exact entry and exit), visit SB Trade Desk


original source

DailyFX provides forex news and technical analysis on the trends that influence the global currency markets.
Learn forex trading with a free practice account and trading charts from FXCM.