
 Yahoo Finance
 USD/CAD Daily Forecast – Plummeting Oil Prices Kept the Pair Uplifted
For the second day in a row, the Loonie pair continues to hold onto 1.34 top levels on Tuesday. After knocking off last day’s high near 1.3420 levels, the pair appeared to move slightly lower today. During the early hours, the USD/CAD pair was taking rounds around 1.3400 marks.
The focus for the day remains over the retreating USD Index. The Greenback was heading southwards in the Asian session, breaking the healthy 97.41 support level. If the downward movement in the Index continues, then the next target stays near 97.37 and 97.35 levels. The last day’s disappointing US data strengthened hopes for a Fed rate cut. The market remains anticipated as the policymakers would discuss on the same tomorrow.
Meanwhile, the Crude prices extended the previous day’s downtrend into today’s session. After touching the $52.99 bbl yesterday, the plunge rally in the prices reached to $51.60 bbl last night. The Oil prices were trading near $51.77 bbl in the Asian session.

“The (oil) market is in a rut and desperately in need of some robust economic data to get it out of this funk,” said Stephen Innes, Managing Partner at Vanguard Markets in Bangkok.
The escalating US-China and US-Iran tensions kept adding considerable downward pressure on the prices. Meantime, Trump would meet Xi later this month in the G20 meeting and would talk over resolving the trade dispute. However, the ongoing OPEC-led supply cuts acted as a cushion for the falling prices. The OPEC members ensured to limit the lower side for the commodity’s market value.
USD/CAD Influential Events
On the USD-side, May MoM Housing Data is something which needs extra attention. The market stays in-line over Building Permits, and a slight bullish over the Housing Starts data.
April MoM Canadian Manufacturing Shipments will come out at around 12:30 GMT. Street analysts expect a 1.6% drop in the figures this time over previous 2.1%.
At around 20:30 GMT, traders eye for the API Weekly Crude Oil Stock report computed since June 14. The inventories had recorded 4.85 million last time.
Technical Analysis
1-Hour Chart
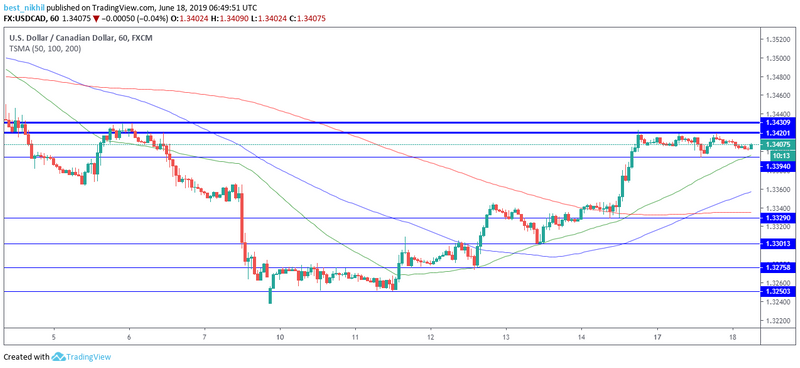
The sentiment in the short-term might end up negative, seeing the willingness movement of the 50-days SMA to move upwards. The near term SMA overtook the 100-days SMA on June 13. Quite swiftly, the 50-days SMA crossed above the significant 200-days SMA on June 14. The SMA has almost reached close to the USD/CAD pair. The indicator might move even above the pair developing a bearish near-term trend. In such a case, 1.3394 and 1.3329 support lines would act as the necessary cushion. However, the main trend continues to remain positive, creating sound bullish actions in the medium term.
4-Hours Chart
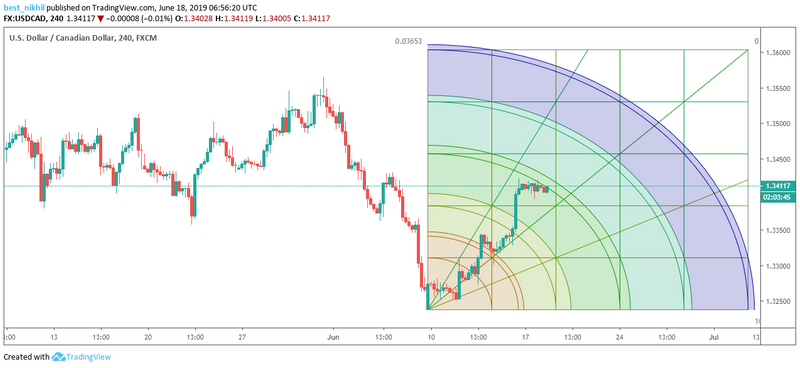
The pair appeared to stay hold onto uptrend moving along the Gann Square trend line. The pair seemed to pause the upward rally as it encountered some resistance forces near 1.3410 Gann Curves. Any rebound action would find support near 1.3385 levels.
This article was originally posted on FX Empire
