
 Yahoo Finance
 US Dollar Technical Analysis – Candles Warn Rebound Over
To receive Ilya's analysis directly via email, please SIGN UP HERE
Talking Points:
US Dollar Technical Strategy: Holding Long via Mirror Trader Basket **
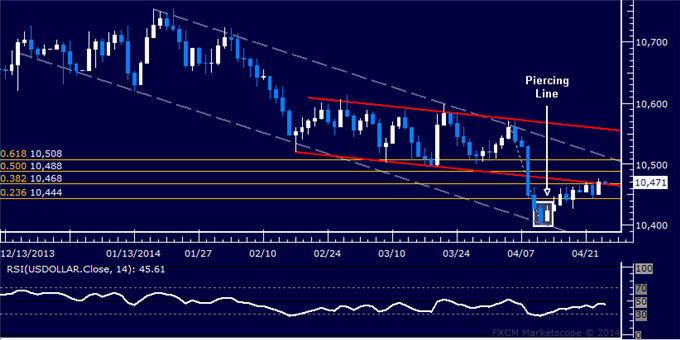
Support: 10430 (23.6% Fib exp.), 10405 (38.2% Fib exp.)
Resistance: 10467 (minor channel floor), 10517 (major channel top)
The Dow Jones FXCM US Dollar Index put in a Bearish Engulfing candlestick pattern below support-turned-resistance at the bottom of a falling channel set from mid-February, hinting a move lower may be ahead. Initial support is at 10430, the 23.6% Fibonacci expansion, with a break below that targeting the 38.2% level at 10405. A turn above resistance aims for the top of a larger falling channel in play since the beginning of the year, now at 10517.
Our long-term fundamental view continues to call for a stronger US Dollar against its key counterparts in the months ahead. As such, we remain long the benchmark currency via theMirror Trader US Dollar currency basket.
Weekly Chart - Created Using FXCM Marketscope 2.0
** The Dow Jones FXCM US Dollar Index and the Mirror Trader USD basket are not the same product.
--- Written by Ilya Spivak, Currency Strategist for DailyFX.com
DailyFX provides forex news and technical analysis on the trends that influence the global currency markets.
Learn forex trading with a free practice account and trading charts from FXCM.
