Underperform: SMRT & CDL HT
Tradeable Ideas is a new weekly column by Tradeable. This column focuses on locally listed companies or particular sectors that have attracted strong interest from analysts at various research houses. Tradeable Ideas is meant to serve as a springboard for investors’ interest in specific stocks or sectors in Singapore.
SMRT Corporation
SMRT Corporation (SMRT) announced its disappointing financial results earlier this week. It attracted the attention of analysts after its profit fell behind consensus estimates which analysts had previously given much leeway to. This sparked further worries about the ailing health of its business model as the current results affirms the difficult situation it is in.
The fall in profit was due to higher operating expenses faced by SMRT in the public transportation sector (MRT, LRT & bus operations), which was further dragged down by the muted revenue growth. Previously, the Ministry of Transportation (MOT) has acknowledged the financial pressures faced by public transport operators.
Looking forward, the operating costs are expected to increase with the annual wage increment and higher headcount, depreciation of operating assets (trains, buses & taxis) and higher maintenance cost from the troubled train services. However, SMRT is currently in talks with MOT on a new rail financing framework to improve the overall sustainability of the trains business which might give SMRT an upside if successful.
With the challenging environment to remain in the near future, calls from the street is extremely bearish. All three research houses gave SMRT a “Sell” rating with a potential downside of 16.01 percent.
Source: FactSet, 1-Month Chart Of SMRT
CDL Hospitality Trust
CDL Hospitality Trust (CDLHT) missed their earnings estimates as they reported a fall in net property income. This is a result of stiffening competition in Singapore’s hospitality industry and absence of the biennial Food & Hotel Asia event in April. However, higher contribution from its overseas properties managed to partially defrayed the weaker earnings from Singapore.
Despite the lower income, CDLHT’s distributable income per unit was in line with estimates from the street. The income available for distribution after retained income is $0.0272. Earnings for the trust in the coming half of the year should stabilise as demand should remain stable with Singapore’s continual efforts to enhance the tourism landscape as well as a brighter-looking booking for this year’s Formula One race.
Albeit short term uncertainties, DBS Vickers Research believe that the stock offers a re-look at close to 1x P/BV, forward yields of c6.5-6.8 percent. They gave CDLHT a “Buy” rating with a potential appreciation of 15.25 percent.
Daily Chart Of CDL Hospitality Trust As At 31 July 2013
Source: Chartnexus, Technical Chart For CDL H Trust
Looking at the chart above, one can see that the price of CDL Hospitality Trust (CDL HTrust) has witnessed and gone through a literal downward swing, after failing to close above the $2.12 level since late April 2013.
As at 31 July, CDL HTrust is trading well below its 50-day moving average (MA), and slightly below that of its 20-day MA. Downward possibility in price action might still continue if buying volume does not pick up. It will most likely test the 100 percent fibonnacci retracement level at $1.65. This level has been tested twice, with no breakthroughs, thus it will be a level to be watched.
In the event that the Moving Average Convergence Divergence (MACD), shown below the chart, moves above the zero line and its signal line does a positive cross over with the blue MA line, do observe if price action moves up in tandem with increased volume, to confirm MACD’s bullish signal. A near resistance for price would be to test the 20-day moving average, around the $1.69-$1.70 region.
Notice to readers: Due to the National Day Holiday next week, Tradeable Idea will not be published. Publishing will be resumed on the following week! Starhub
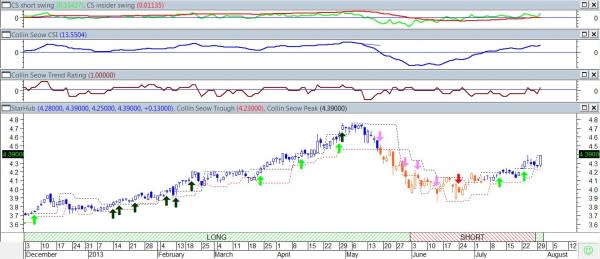
Source: Source: Collin Seow, Daily Chart Of StarhubThe above chart for Starhub is selected for a potential long position.The second buy arrow is seen on 23 July 2013.
The peak (Resistance) is at $ 4.28 and the trough (Support) is at $4.23.
To learn more about the CSI Trading system, please click here.
More From Shares Investment:

 Yahoo Finance


