
 Yahoo Finance
 U.S. Silica (SLCA) Earnings and Revenues Miss Estimates in Q3
U.S. Silica Holdings, Inc. SLCA slipped to loss of $23 million or 31 cents per share in third-quarter 2019 from profit of $6.3 million or 8 cents per share in the year-ago quarter.
Adjusted loss was 17 cents per share, which was wider than the Zacks Consensus Estimate of loss of 4 cents.
U.S. Silica generated revenues of $361.8 million, declining around 14.5% year over year. The figure missed the Zacks Consensus Estimate of $394.8 million.
The company witnessed seasonal slowdown in the demand for sand in its Oil & Gas unit in the reported quarter.
U.S. Silica Holdings, Inc. Price, Consensus and EPS Surprise
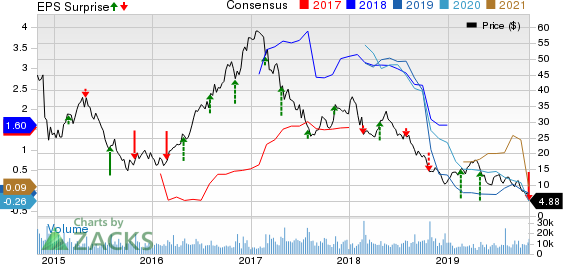
U.S. Silica Holdings, Inc. price-consensus-eps-surprise-chart | U.S. Silica Holdings, Inc. Quote
Segment Highlights
Revenues in the Oil & Gas division were $242.7 million, down 20% year over year. Overall sales volume rose 2% year over year to 3.896 million tons. Oil & Gas contribution margin declined 44% year over year to $50.6 million or $12.98 per ton.
Revenues in the Industrial and Specialty Products (“ISP”) division were $119.1 million in the quarter, down 1% year over year. Overall sales volume fell 3% year over year to 0.954 million tons. ISP contribution margin was $44.4 million or $46.52 per ton in the quarter under review, down 9% year over year.
Financials
At the end of the third quarter, cash and cash equivalents were down 84.5% year over year to $187.3 million. Long-term debt was roughly $1,216.8 million, up 2.8% year over year.
The company also generated operating cash flow of $33.9 million in the quarter.
Outlook
It witnessed delays in purchasing decisions by certain customers in the Industrial & Specialty Products unit. Increased level of uncertainty in global industrial markets, intensified by tariffs, political uncertainty and increasing risk of economic slowdown makes it tough for the company to provide forecast for the business. The fourth quarter is usually characterized by a seasonal decrease in profitability of roughly 10%, per the company.
U.S. Silica expects a slowdown in North America completion activity to unfavorably impact the Oil & Gas unit’s fourth-quarter results. The company expects Oil & Gas sand volume to decline roughly 10% sequentially in the fourth quarter. Moreover, it anticipates contribution margin per ton to decrease on lower sand and SandBox volumes, loss of fixed cost leverage, continuous pricing pressure, lower expected customer shortfall penalties, and other contractual fees.
Price Performance
Shares of U.S. Silica have plunged 66.7% in the past year against the industry’s 4.4% growth.

Zacks Rank & Stocks to Consider
U.S. Silica currently carries a Zacks Rank #5 (Strong Sell).
Some better-ranked stocks in the basic materials space are Kinross Gold CorporationKGC, Franco-Nevada Corporation FNV and Kirkland Lake Gold Ltd. KL, each currently sporting a Zacks Rank #1 (Strong Buy). You can see the complete list of today’s Zacks #1 Rank stocks here.
Kinross has an expected earnings growth rate of 210% for 2019. The company’s shares have surged 84.1% in the past year.
Franco-Nevada has a projected earnings growth rate of 39.3% for 2019. The company’s shares have rallied 51.9% in a year.
Kirkland Lake Gold has an estimated earnings growth rate of 93.4% for the current year. Its shares have moved up 125% in the past year.
Today's Best Stocks from Zacks
Would you like to see the updated picks from our best market-beating strategies? From 2017 through 2018, while the S&P 500 gained +15.8%, five of our screens returned +38.0%, +61.3%, +61.6%, +68.1%, and +98.3%.
This outperformance has not just been a recent phenomenon. From 2000 – 2018, while the S&P averaged +4.8% per year, our top strategies averaged up to +56.2% per year.
See their latest picks free >>
Want the latest recommendations from Zacks Investment Research? Today, you can download 7 Best Stocks for the Next 30 Days. Click to get this free report
Franco-Nevada Corporation (FNV) : Free Stock Analysis Report
Kinross Gold Corporation (KGC) : Free Stock Analysis Report
U.S. Silica Holdings, Inc. (SLCA) : Free Stock Analysis Report
Kirkland Lake Gold Ltd. (KL) : Free Stock Analysis Report
To read this article on Zacks.com click here.
Zacks Investment Research
