
 Yahoo Finance
 U.S. Bancorp (NYSE:USB) investors are sitting on a loss of 39% if they invested a year ago
It's easy to match the overall market return by buying an index fund. Active investors aim to buy stocks that vastly outperform the market - but in the process, they risk under-performance. For example, the U.S. Bancorp (NYSE:USB) share price is down 42% in the last year. That's disappointing when you consider the market declined 1.0%. Longer term shareholders haven't suffered as badly, since the stock is down a comparatively less painful 14% in three years. Furthermore, it's down 36% in about a quarter. That's not much fun for holders. We note that the company has reported results fairly recently; and the market is hardly delighted. You can check out the latest numbers in our company report.
Since shareholders are down over the longer term, lets look at the underlying fundamentals over the that time and see if they've been consistent with returns.
View our latest analysis for U.S. Bancorp
While the efficient markets hypothesis continues to be taught by some, it has been proven that markets are over-reactive dynamic systems, and investors are not always rational. By comparing earnings per share (EPS) and share price changes over time, we can get a feel for how investor attitudes to a company have morphed over time.
Unhappily, U.S. Bancorp had to report a 19% decline in EPS over the last year. This reduction in EPS is not as bad as the 42% share price fall. This suggests the EPS fall has made some shareholders are more nervous about the business. The less favorable sentiment is reflected in its current P/E ratio of 8.36.
The graphic below depicts how EPS has changed over time (unveil the exact values by clicking on the image).
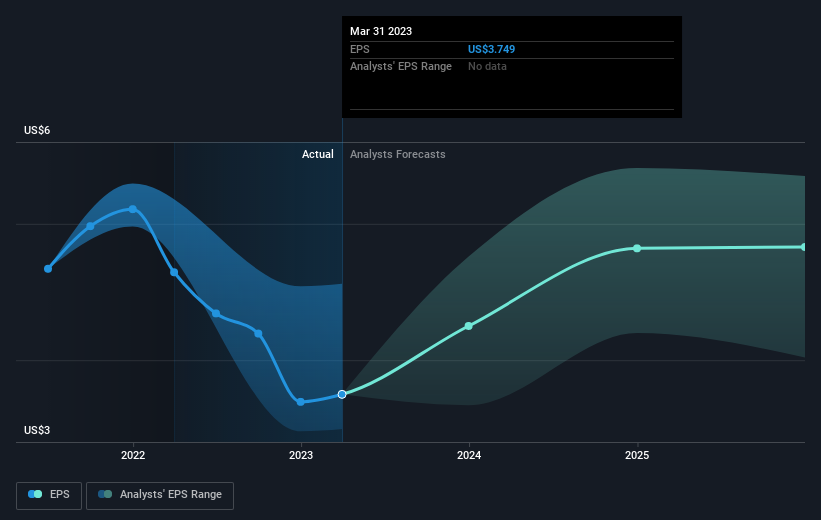
It's probably worth noting we've seen significant insider buying in the last quarter, which we consider a positive. On the other hand, we think the revenue and earnings trends are much more meaningful measures of the business. Dive deeper into the earnings by checking this interactive graph of U.S. Bancorp's earnings, revenue and cash flow.
What About Dividends?
It is important to consider the total shareholder return, as well as the share price return, for any given stock. The TSR is a return calculation that accounts for the value of cash dividends (assuming that any dividend received was reinvested) and the calculated value of any discounted capital raisings and spin-offs. So for companies that pay a generous dividend, the TSR is often a lot higher than the share price return. We note that for U.S. Bancorp the TSR over the last 1 year was -39%, which is better than the share price return mentioned above. This is largely a result of its dividend payments!
A Different Perspective
Investors in U.S. Bancorp had a tough year, with a total loss of 39% (including dividends), against a market gain of about 1.0%. However, keep in mind that even the best stocks will sometimes underperform the market over a twelve month period. Unfortunately, last year's performance may indicate unresolved challenges, given that it was worse than the annualised loss of 5% over the last half decade. Generally speaking long term share price weakness can be a bad sign, though contrarian investors might want to research the stock in hope of a turnaround. It's always interesting to track share price performance over the longer term. But to understand U.S. Bancorp better, we need to consider many other factors. Consider risks, for instance. Every company has them, and we've spotted 1 warning sign for U.S. Bancorp you should know about.
U.S. Bancorp is not the only stock that insiders are buying. For those who like to find winning investments this free list of growing companies with recent insider purchasing, could be just the ticket.
Please note, the market returns quoted in this article reflect the market weighted average returns of stocks that currently trade on American exchanges.
Have feedback on this article? Concerned about the content? Get in touch with us directly. Alternatively, email editorial-team (at) simplywallst.com.
This article by Simply Wall St is general in nature. We provide commentary based on historical data and analyst forecasts only using an unbiased methodology and our articles are not intended to be financial advice. It does not constitute a recommendation to buy or sell any stock, and does not take account of your objectives, or your financial situation. We aim to bring you long-term focused analysis driven by fundamental data. Note that our analysis may not factor in the latest price-sensitive company announcements or qualitative material. Simply Wall St has no position in any stocks mentioned.
Join A Paid User Research Session
You’ll receive a US$30 Amazon Gift card for 1 hour of your time while helping us build better investing tools for the individual investors like yourself. Sign up here
