
 Yahoo Finance
 Trading Trends with MACD
Article Summary: Creating a Forex trading strategy does not have to be a difficult process. Today we will review trading trends with MACD.
MACD (Moving Average Convergence Divergence) indicator is one of the most commonly used indicators in Forex trading. MACD was developed in the 1970s by Gerald Appel as an oscillator that graphically displays moving averages in relation to price. MACD falls into the same family as RSI, CCI and Stochastics, but this indicator can be used to assist traders with finding market momentum, direction, and entries by understanding the MACD line, signal line, zero line and histogram. Before the MACD can become useful to us as traders, we first need to better understand its components.
The MACD Line is displayed in red in the indicator below and is built by comparing a 12 period EMA (Estimated Moving Average) to a 26 period EMA. By comparing moving averages of different durations we can change shifts in trend as it oscillates up and down. Our signal line is comprised of a 9 period EMA of MACD. Just as the name of the indicator implies, we are looking for these averages to diverge (move apart) or converge (move together). Normally MACD traders will either look for the MACD line to cross above the Signal Line to buy in an uptrend or fall below the signal line to sell in a downtrend.
Learn Forex – MACD Components
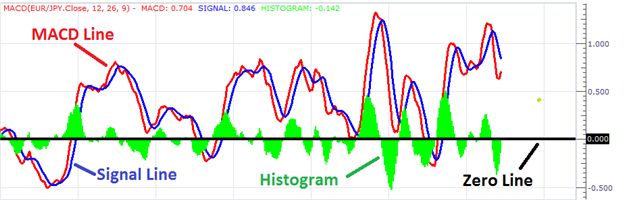
(Created using FXCM’s Marketscope 2.0 charts)
The second component of the indicator is the MACD histogram. This component is specifically designed to help us see if the MACD Line is moving away or closer to our Signal Line. If the histogram is above the zero line that means the MACD Line resides above the signal line. If the histogram is below the zero line the inverse is true. It is important to note, the stronger the MACD Line pulls away from the signal line, the great the histogram will read.
The last component we have to the MACD indicator is the Zero Line. This point of reference divides our indicator in half and allows us to interpret market direction. If the MACD Line is over the Zero Line this is interpreted as the market having bullish momentum. Conversely, traders will watch for bearish momentum as the indicator moves below the Zero Line. Traders will keep a close watch on this value to identify potential momentum shifts and directional trend changes in the market.
Learn Forex – EURJPY 4Hour Trend with MACD
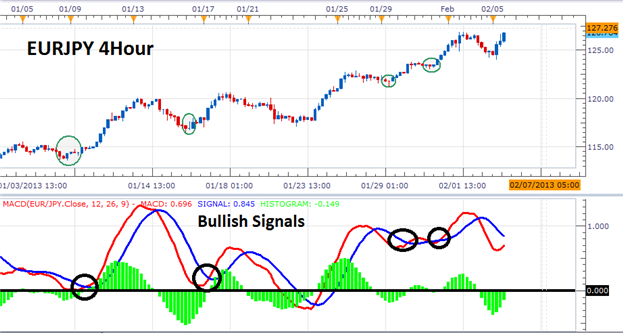
(Created using FXCM’s Marketscope 2.0 charts)
Once we understand all the components, we can then put them to use for trading trends. Above is an example of a traditional MACD crossover strategy using the Zero Line as a filter on a EURJPY 4Hour chart. Currently the EURJPY is in an extended uptrend so traders will look for bullish crossovers comprised of the red MACD Line crossing over the blue Signal Line. Traders will only want to buy when momentum to the upside is the strongest which means any crossovers occurring under the zero line will be excluded.
---Written by Walker England, Trading Instructor
To contact Walker, emailwengland@fxcm.com. Follow me on Twitter at @WEnglandFX.
To be added to Walker’s e-mail distribution list,CLICK HEREand enter in your email information
Looking for an oscillator strategy to trade? Take our free CCI training course and learn new ways to trade with this versatile oscillator.Register HEREto start learning your next CCI strategy!
DailyFX provides forex news and technical analysis on the trends that influence the global currency markets.
Learn forex trading with a free practice account and trading charts from FXCM.
