
 Yahoo Finance
 Top Ranked Value Stocks to Buy for September 13th


Here are four stocks with buy rank and strong value characteristics for investors to consider today, September 13th:
Caleres, Inc. (CAL): This retailer of footwear has a Zacks Rank #2 (Buy), and seen the Zacks Consensus Estimate for its current year earnings increasing 0.8% over the last 60 days.
Caleres, Inc. Price and Consensus
Caleres, Inc. price-consensus-chart | Caleres, Inc. Quote
Caleres has a price-to-earnings ratio (P/E) of 15.26, compared with 17.40 for the industry. The company possesses a Value Score of A.
Caleres, Inc. PE Ratio (TTM)
Caleres, Inc. pe-ratio-ttm | Caleres, Inc. Quote
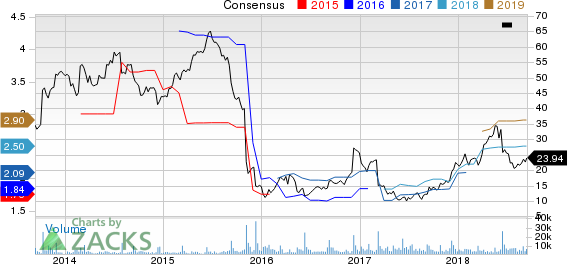
Group 1 Automotive, Inc. (GPI): This automotive retail company has a Zacks Rank #2 (Buy), and seen the Zacks Consensus Estimate for its current year earnings rising 6.4% over the last 60 days.
Group 1 Automotive, Inc. Price and Consensus
Group 1 Automotive, Inc. price-consensus-chart | Group 1 Automotive, Inc. Quote
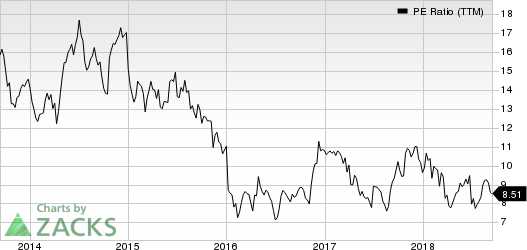
Group 1 Automotive has a price-to-earnings ratio (P/E) of 8.33, compared with 12.20 for the industry. The company possesses a Value Score of A.
Group 1 Automotive, Inc. PE Ratio (TTM)
Group 1 Automotive, Inc. pe-ratio-ttm | Group 1 Automotive, Inc. Quote
Tailored Brands, Inc. (TLRD): This specialty apparel retailer has a Zacks Rank #2 (Buy), and seen the Zacks Consensus Estimate for its current year earnings increasing 0.4% over the last 60 days.
Tailored Brands, Inc. Price and Consensus
Tailored Brands, Inc. price-consensus-chart | Tailored Brands, Inc. Quote
Tailored Brands has a price-to-earnings ratio (P/E) of 9.44, compared with 28.10 for the industry. The company possesses a Value Score of A.
Tailored Brands, Inc. PE Ratio (TTM)
Tailored Brands, Inc. pe-ratio-ttm | Tailored Brands, Inc. Quote
Office Depot, Inc. (ODP): This leading provider of products for every workplace has a Zacks Rank #2 (Buy), and seen the Zacks Consensus Estimate for its current year earnings rising 9.4% over the last 60 days.
Office Depot, Inc. Price and Consensus
Office Depot, Inc. price-consensus-chart | Office Depot, Inc. Quote
Office Depot has a price-to-earnings ratio (P/E) of 9.12, compared with 19.50 for the industry. The company possesses a Value Score of A.
Office Depot, Inc. PE Ratio (TTM)
Office Depot, Inc. pe-ratio-ttm | Office Depot, Inc. Quote
See the full list of top ranked stocks here
Learn more about the Value score and how it is calculated here.
Today's Stocks from Zacks' Hottest Strategies
It's hard to believe, even for us at Zacks. But while the market gained +21.9% in 2017, our top stock-picking screens have returned +115.0%, +109.3%, +104.9%, +98.6%, and +67.1%.
And this outperformance has not just been a recent phenomenon. Over the years it has been remarkably consistent. From 2000 - 2017, the composite yearly average gain for these strategies has beaten the market more than 19X over. Maybe even more remarkable is the fact that we're willing to share their latest stocks with you without cost or obligation.
See Them Free>>
Want the latest recommendations from Zacks Investment Research? Today, you can download 7 Best Stocks for the Next 30 Days. Click to get this free report
Tailored Brands, Inc. (TLRD) : Free Stock Analysis Report
Office Depot, Inc. (ODP) : Free Stock Analysis Report
Group 1 Automotive, Inc. (GPI) : Free Stock Analysis Report
Caleres, Inc. (CAL) : Free Stock Analysis Report
To read this article on Zacks.com click here.
Zacks Investment Research
