
 Yahoo Finance
 There's tremendous churn beneath the surface of the seemingly calm stock market

The S&P 500 is down a little over 1% from its record highs.
And since the March 1 rally that saw the Dow (^DJI) rise over 300 points, the S&P 500 (^GSPC) briefly crack 2,400, and the benchmark index break its streak of 94 trading days since its last 1% move, stocks have largely done nothing. Volatility as measured by the VIX (^VIX) has also collapsed since the election, giving the impression of placid markets across the board.
But underneath the surface of this seemingly placed headline index change has been a much more violent move among members of the index. And, simply put, the headline calm we’re seeing in the S&P 500 is masking some major losses among index members.

Michael Batnick, director of research at Ritholtz Wealth Management, observed last week that while the S&P was down just 1.6% from its 52-week high, the average stock was down 10% from this level and the median stock was off 6% from this high.
Additionally, Batnick noted that all ten of the index’s biggest components were within 3% of recent highs with the exception of Exxon. In other words, most of the pain was being felt my smaller companies. This largely jives with the losses we’ve seen in the Russell 2000 of late, which is down about 3% from its most recent high.
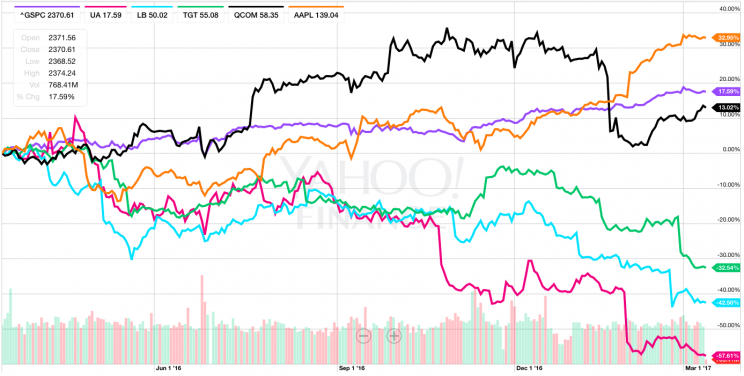
Some notable S&P 500 members down big from their 52-week highs include:
Under Armour (UA), down 63%
L Brands (LB), down 41%
Gilead Sciences (GILD), down 33%
Target (TGT), down 32%
Bristol-Myers Squibb (BMY), down 24%
Qualcomm (QCOM), down 16%
Nvidia (NVDA), down 16%
Now, the obvious qualifier needed in the discrepancy between the index’s performance and the losses of some constituents is the way the S&P 500 is constructed.
As a market cap-weighted index, the S&P 500 is likely to reflect the fortunes of its largest constituents more than its smaller members. Apple (AAPL), the world’s biggest company, has a market cap of $730 billion and accounted for about 3.6% of the index as of the end of February. For each point that Apple moves in either direction, the S&P 500 moves about 0.65 points. Over the last year, Apple is up about 36%, or $36.80 per share, accounting for roughly 24 of the 347 points the index has moved over that period.
The largest 10 members of the S&P 500 account for about 18% of the index. Of the largest 10 S&P 500 members, only Exxon Mobil (XOM) — down 12% — is off more than 10% from its most recent 52-week high. And among the top 10 biggest companies in the index, six have market caps of $400 billion or more, while just 19 stocks overall have market caps larger than $200 billion.
A continuing theme
And while the exact composition of the S&P 500 can lend itself to some discrepancies between the overall market and the fortunes of some individual members, this recent divide is part of a continuing theme in markets.
Last week, on Yahoo Finance’s The Final Round, Joe Fahmy of Zor Capital discussed what he called the “brutal bear market” of late 2015 and early 2016, which happened underneath a headline index that from August 31, 2015 through March 31, 2016, was up 3.6%.
“Financials corrected 25%, biotech 40%, and energy 50%,” Fahmy said. “And if you look at just small- and mid-caps, they corrected between 25% and 30%, and the median stock was down over 20%. So individual stocks were down much greater than the indexes were masking.”
Since Donald Trump’s presidential election win, the stock market has been perhaps the most vivid indication of the confidence Trump has engendered among business leaders and consumers.
And, overall, the headline index has done quite well. But there is still plenty of pain to be felt in the market, even with stocks at record highs.
—
Myles Udland is a writer at Yahoo Finance. Follow him on Twitter @MylesUdland
Read more from Myles here:
