
 Yahoo Finance
 Technical Overview of EUR/USD, NZD/USD, USD/CAD & USD/CHF for 03.01.2019
EUR/USD
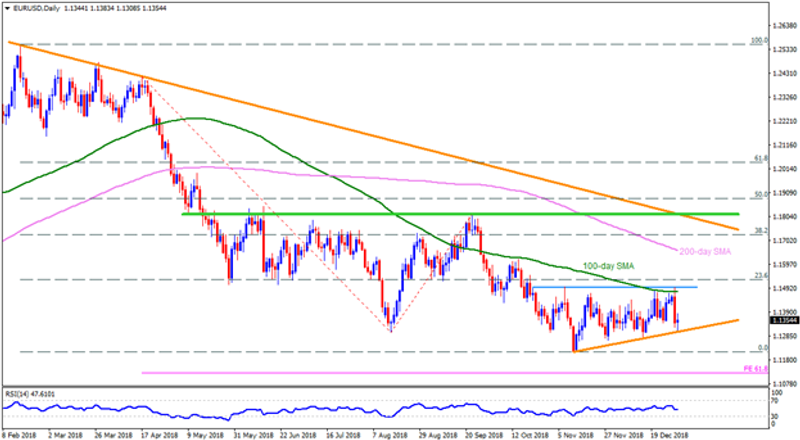
Following its U-turn from 1.1490-1.1500 resistance-region, EURUSD bounced off the seven-week long ascending support-line, near 1.1295, which in-turn signal brighter chances for the 1.1400 and the 1.1420 to reappear on the chart. However, 100-day SMA level of 1.1480 and the 1.1490-1.1500 could confine the pair’s upside past-1.1420, if not then the 1.1560, the 1.1610 and the 1.1660, including 200-day SMA, might flash on Buyers’ radar to target. If at all the pair fails to sustain recent move and registers a daily closing under 1.1295, it’s drop to 1.1260 and 1.1215 can’t be negated. Also, pair’s additional downside beneath 1.1215 may make the 61.8% FE level of 1.1120 as market favorite.
NZD/USD

Alike EURUSD, the NZDUSD also rests on immediate TL support, here it is 0.6580, break of which is necessary for the pair to decline further in direction to 0.6550 & 0.6500 numbers to south. Should prices continue trading down after 0.6500, the 0.6470 and the 0.6470 can regain Bears’ attention. Alternatively, the 100-day SMA level of 0.6670 and the 0.6685-0.6700 region may limit the pair’s near-term advances, which if broken highlights the importance of 0.6755, including 50-day SMA. Assuming the pair’s successful rise beyond 0.6755, the 200-day SMA level of 0.6815 and the nine-month old resistance-line, at 0.6925, could lure the Bulls.
USD/CAD

In spite of its latest pullback, USDCAD is less likely to be termed weak unless it prints a W1 close below 1.3560-40 support-zone. As a result, the pair is expected to stretch its north-run a bit longer prior to confronting an upside barrier, i.e. the 1.3790-1.3820 resistance-confluence. Given the pair manage to conquer the 1.3820 hurdle on a weekly closing, the 1.3930 and the 1.4000 might be targeted if holding long positions. Meanwhile, break of 1.3540 can trigger the pair’s declines to 1.3440 and the 1.3380 rest-points, breaking which 1.3300 and the 1.3230 may please the sellers.
USD/CHF
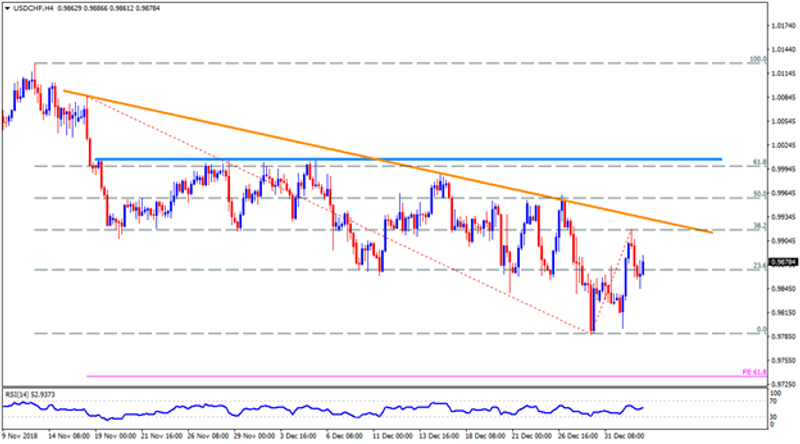
Not only a downward slanting trend-line at 0.9935 but the 1.0005-10 resistance-area also restricts the USDCHF upside. Hence, the pair needs to clear both these resistances in order to aim for 1.0040 and the 1.0080 ahead of looking at the 1.0110 & the 1.0130 figures to north. On the contrary, the 0.9840 and the 0.9815 seem adjacent supports for the pair, breaking which 0.9785 and the 61.8% FE level of 0.9735 might challenge the downside.
This article was originally posted on FX Empire
