
 Yahoo Finance
 Technical Overview of EUR/USD, GBP/USD, USD/JPY & NZD/USD: 04.12.2018
EUR/USD
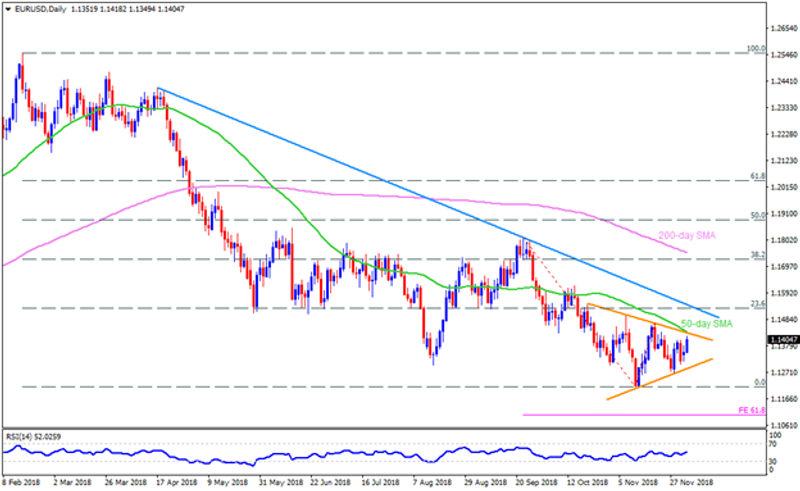
In spite of the EURUSD’s recent recovery, the pair is still left to surpass 1.1430-35 resistance-confluence, comprising 50-day SMA & immediate TL barrier, which in-turn may trigger the quote’s dip to 1.1300 but an upward slanting support-line, at 1.1280, can limit its additional downside. In case the pair continue trading southwards past-1.1280, the 1.1260 and the 1.1215 could be cause of concern as break of which might not hesitate fetching the pair to 61.8% FE level of 1.1100. Should extra short-covering fuels the pair beyond 1.1435 on a daily closing basis, the 1.1500 and the 1.1545 trend-line may gain market attention. Though, pair’s ability to cross 1.1545 could quickly flash 1.1620 and the 1.1715-20 on Bulls’ radars to target.
GBP/USD
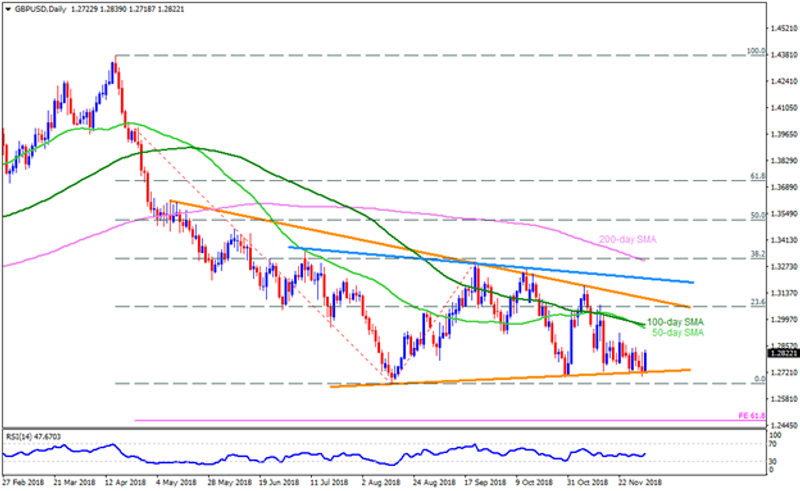
With nearly sixteen-week long ascending TL has been restricting the GBPUSD’s downturn around 1.2715-10, the pair is likely witnessing pullback towards 1.2880-85 while 50-day & 100-day SMA confluence area, between 1.2960 and 1.2970, can confine its further advances. Assuming the pair manages to conquer 1.2970 on D1 basis, the 1.3070, the 1.3110 and the 1.3220 can entertain buyers prior to challenging them with 200-day SMA level of 1.3305. Alternatively, sustained drop beneath the 1.2710 could drag prices to the 1.2660 and then to 1.2600 whereas 61.8% FE level of 1.2465 is expected to please Bears afterwards.
USD/JPY

Break of adjacent support-line can’t be considered as a strong sign for the USDJPY’s decline as another one at 112.50, followed by 100-day SMA level of 112.25 on D1 chart, might keep troubling the sellers. Given the pair refrains to respect 112.25 mark, the 111.80 and the 111.35 could be aimed if holding short positions. Meanwhile, 113.20 and the 113.55-60 seem immediate resistances to watch if the pair reverses from present levels, breaking which 114.05-10 horizontal-area comes into play. During the pair’s successful breach of 114.10, the 114.55 and the 115.00 can become optimists’ favorites.
NZD/USD
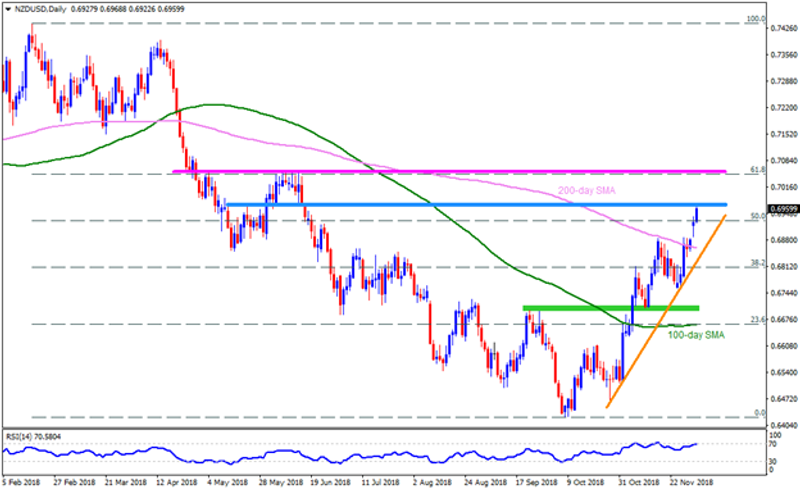
NZDUSD is near to 0.6965-75 resistance-zone and the RSI is also in overbought territory that together signals brighter for the pair’s profit-booking moves in direction to 0.6880 rest-point. However, 200-day SMA level of 0.6860 and near-term ascending trend-line, at 0.6815 now, might activate the pair’s U-turn, if not then 0.6755 could appear on the chart. On the upside, pair’s rise above 0.6975 can help it visit the 0.7000 psychological hurdle ahead of confronting the 0.7050-60 region. It should also be noted that pair’s extended north-run beyond 0.7060 enables it to target the 0.7100 and the 0.7150-55 landmarks.
This article was originally posted on FX Empire
