
 Yahoo Finance
 Technical Checks For EUR/USD, USD/JPY, AUD/USD & USD/CAD: 16.10.2018
EUR/USD

Even after recovering from 1.1430-25 support-zone, the EURUSD has to surpass 100-day SMA level of 1.1630 in order to justify its strength in targeting the seven-month long descending resistance-line, around 1.1730. Should prices rally beyond 1.1730 on a daily closing basis, the 1.1810 & 1.1850 are likely intermediate halts that can be availed prior to aiming the 1.1920 level, comprising 200-day SMA. In case the pair witness downside pressure, the 1.1520, the 1.1500 and the 1.1430 may entertain short-term sellers before again highlighting the importance of 1.1430-25 area. Given the pair’s refrain to respect the 1.1425 mark, the 1.1360 and the 1.1300 seem crucial as break of which could open the door for its plunge to 61.8% FE level of 1.1125.
USD/JPY
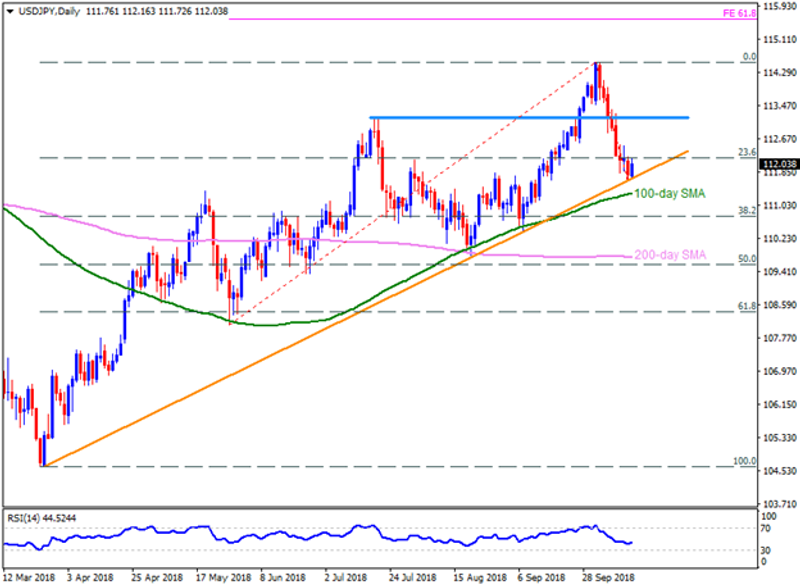
With an upward slanting trend-line restricting the USDJPY’s declines at the moment, chances of the pair’s pullback to 112.60 can’t be denied. However, the 113.15-20 region could limit the pair’s advances past-112.60, if not then 113.50-60 and the 114.10 might lure the buyers. Assuming the quote’s sustained rally above 114.10, the 114.55 and 61.8% FE level of 115.60 may flash on the Bulls’ radar. Alternatively, a D1 close beneath the 111.60 can fetch the pair to 100-day SMA level of 111.25, breaking which 110.80 could mark its presence on the chart. Additionally, pair’s extended south-run below 110.80 may take rest around 110.00 and 200-day SMA level of 109.75 ahead of aiming the sub-109.00 zone.
AUD/USD
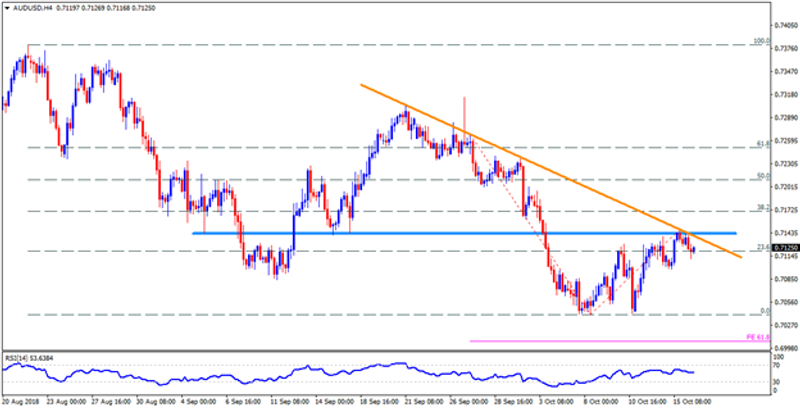
AUDUSD needs to conquer the 0.7140-45 resistance-confluence if it is to revisit the 0.7200 and the 0.7235-40 resistances. Though, pair’s successful break above 0.7240 might not hesitate pleasing optimists with 0.7275 and the 0.7310 numbers to north. Meanwhile, 0.7100-0.7095 can act as adjacent supports for the pair, breaking which 0.7040 could regain market attention. If the pair drops below 0.7040, the 0.7000 round-figure may appear in limelight.
USD/CAD

Having failed to hold its 100-day SMA breakout, needless to mention about inability to clear the 1.3075-85 resistance-region, the USDCAD is likely declining towards the 1.2930 and the 200-day SMA level of 1.2890 but ascending support-line, at 1.2800, may challenge the Bears afterwards. Should prices dip beneath 1.2800, the 1.2740 & 1.2680 can be targeted if holding short positions. On the upside, successful break above 100-day SMA level of 1.3065 should be backed by the pair’s rise beyond 1.3075-85 to portray its capacity to question the 1.3145 resistance-line. In case the quote closes above 1.3145, its rally to 1.3220 & 1.3260 can be expected.
This article was originally posted on FX Empire
