
 Yahoo Finance
 SVB Financial (SIVB) Q4 Earnings Beat, Revenues & Costs Rise
SVB Financial Group’s SIVB fourth-quarter 2021 adjusted earnings per share of $6.56 comfortably outpaced the Zacks Consensus Estimate of $6.29. In the year-ago quarter, the company recorded earnings of $7.40 per share.
The reported quarter and 2021 earnings figures exclude merger-related charges in connection with Boston Private Financial Holdings but include the day-one provision on non-purchased credit deteriorated loans and unfunded credit commitments acquired in connection with the merger.
Results largely benefited from growth in revenues. Loans and deposit balances witnessed sequential improvement in the quarter. However, a rise in expenses and lower net interest margin (NIM) were the undermining factors.
Net income available to common shareholders (GAAP basis) was $371 million, down 4.4% from the prior-year quarter’s level.
For 2021, adjusted earnings per share were $32.93, which outpaced the Zacks Consensus Estimate of $31.53. In 2020, the company recorded earnings of $22.87 per share. Net income available to common shareholders (GAAP basis) was $1.77 billion, up 48.6% from the previous year.
Revenues Improve, Expenses Rise
Quarterly net revenues (tax-equivalent) were $1.51 billion, jumping 23.7% year over year. The top line surpassed the Zacks Consensus Estimate of $1.40 billion.
Net revenues (tax-equivalent) for 2021 were $5.95 billion, jumping 48.1% year over year. The top line surpassed the Zacks Consensus Estimate of $5.88 billion.
Quarterly net interest income (NII) was $939 million, which grew 58.6% year over year. However, NIM (on a fully-taxable equivalent basis) contracted 49 basis points (bps) to 1.91%.
Non-interest income was $561 million, down 9.8% from the prior-year quarter’s figure. The fall resulted from a decline in net gains on investment securities, net gains on equity warrant assets, client investment fees and investment banking revenues.
Non-interest expenses increased 35.6% year over year to $902 million. An increase in all expense components, except for net occupancy and other costs, resulted in the rise. Merger-related charges worth $27 million were recorded in the quarter.
The operating efficiency ratio was 60.13%, up from 54.79% in the prior-year quarter. A rise in efficiency ratio indicates lower profitability.
Loans and Deposit Balances Increase
As of Dec 31, 2021, SVB Financial’s total loans amounted to $66.3 billion, increasing 7.8% from the prior quarter’s level. Total deposits jumped 10.5% sequentially to $189.2 billion.
Credit Quality: A Mixed Bag
In the reported quarter, the company recorded provision for credit losses of $48 million against a reduction for credit losses of $38 million in the prior-year quarter.
However, the ratio of allowance for loan losses to total loans was 0.64%, down 35 bps year over year. The ratio of net charge-offs to average loans was 0.01%, down from 0.09% in the year-earlier quarter.
Capital Ratios Improve, Profitability Ratios Deteriorate
At the end of the fourth quarter, common equity tier 1 risk-based capital ratio was 12.11% compared with 11.04% at the end of the prior-year quarter. Total risk-based capital ratio was 16.61%, up from 12.64%.
Return on average assets on an annualized basis was 0.72%, down from 1.49% recorded in the year-ago quarter. Return on average equity was 11.80%, which decreased from 20.23%.
2022 Outlook (Including Boston Private Merger)
Average loans are expected to grow in the low-30s. Average deposit balances are projected to grow in the low-40s.
NII is anticipated to grow in the high-30s. NIM is projected to be 1.90-2.00%.
Core fee income (including client investment fees, foreign-exchange fees, credit card fees, deposit service charges, lending-related fees, wealth management and trust fees, and letters of credit fees) is expected to increase at the mid-20s percentage rate.
SVB Leerink revenues are projected to be $625-$675 million.
Non-interest expenses (excluding merger-related charges) are projected to increase in the low-20s. A total of $40 million worth of pre-tax merger-related charges are anticipated, of which $30 million will be incurred in the first half of 2022 and the remainder in the second half.
Net loan charge-offs are expected to be 0.15-0.35% of average total loans.
The effective tax rate is expected to be 25-27%.
Our Take
The buyout of Boston Private has accentuated SVB Financial’s commitment to the wealth management business. The adoption of Boston Private’s digital platforms will further accelerate SVB Financial’s technology development.
Given its global diversification efforts, SVB Financial remains well-positioned for growth. However, the continuous increase in expenses and pressure on margins are major near-term concerns.
SVB Financial Group Price, Consensus and EPS Surprise
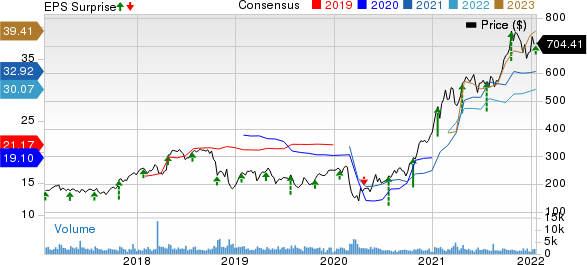
SVB Financial Group price-consensus-eps-surprise-chart | SVB Financial Group Quote
SVB Financial currently carries a Zacks Rank #3 (Hold). You can see the complete list of today’s Zacks #1 Rank (Strong Buy) stocks here.
Performance of Large Banks
Robust advisory business, reserve releases and a rise in loan demand drove JPMorgan’s JPM fourth-quarter 2021 earnings of $3.33 per share. The bottom line handily outpaced the Zacks Consensus Estimate of $3.01. Results included net credit reserve releases. Excluding this, earnings were $2.86 per share.
JPM’s equity markets revenues and fixed-income markets revenues fell 2% and 16%, respectively, on a year-over-year basis. Total markets revenues of $5.3 billion declined 11%. While lower rates continued to hurt JPMorgan’s interest income, it was more than offset by a rise in loan balances.
Bank of New York Mellon Corporation’s BK fourth-quarter 2021 adjusted earnings of $1.04 per share surpassed the Zacks Consensus Estimate of $1.02. The bottom line represents a rise of 8.3% from the prior-year quarter.
BK’s quarterly results were aided by provision benefits and a rise in fee income. Growth in asset balances was another tailwind. However, a marginal fall in net interest income and higher expenses were the undermining factors.
Citigroup C delivered an earnings surprise of 5.04% in fourth-quarter 2021. Income from continuing operations per share of $1.46 handily outpaced the Zacks Consensus Estimate of $1.39. However, the reported figure declined 24% from the prior-year quarter.
Citigroup’s investment banking revenues jumped in the quarter under review, driven by equity underwriting as well as growth in advisory revenues. However, fixed-income revenues were down due to declining rates and spread products.
Want the latest recommendations from Zacks Investment Research? Today, you can download 7 Best Stocks for the Next 30 Days. Click to get this free report
JPMorgan Chase & Co. (JPM) : Free Stock Analysis Report
Citigroup Inc. (C) : Free Stock Analysis Report
The Bank of New York Mellon Corporation (BK) : Free Stock Analysis Report
SVB Financial Group (SIVB) : Free Stock Analysis Report
To read this article on Zacks.com click here.
Zacks Investment Research
