
 Yahoo Finance
 SVB Financial (SIVB) Q4 Earnings & Revenues Beat Estimates
SVB Financial Group’s SIVB fourth-quarter 2019 earnings of $5.06 per share outpaced the Zacks Consensus Estimate of $4.59. Also, the bottom line was 2% higher than the year-ago quarter’s reported figure.
Results were driven by higher revenues as well as growth in loan and deposit balances. Further, the SVB Leerink acquisition offered support. However, higher non-interest expenses and provisions, along with contracting net interest margin (NIM), were major headwinds.
Net income available to common shareholders was $262.9 million, down 1.3% from the prior-year quarter.
For 2019, earnings per share of $21.73 surpassed the consensus estimate of $21.23 and jumped 20% year over year. Net income available to common shareholders was $1.14 billion, up 16.7%.
Revenues & Expenses Rise
Net revenues were $847 million, increasing 20.8% year over year. Further, the top line surpassed the Zacks Consensus Estimate of $786.8 million.
For 2019, net revenues jumped 25.7% to $3.32 billion. Also, it beat the consensus estimate of $3.24 billion.
Net interest income (NII) was $533.7 million, increasing 3.7% year over year. However, NIM on a fully-taxable equivalent basis, contracted 43 basis points (bps) to 3.26%.
Non-interest income came in at $313.3 million, surging 67.8% year over year. This upswing resulted from rise in all the components of fee income.
Non-interest expenses rose 49.8% to $460.8 million. Increase in all expense resulted in this upside.
Non-GAAP core operating efficiency ratio was 54.40%, up from the prior-year quarter’s 45.42%. A rise in efficiency ratio indicates lower profitability.
Loans and Deposit Balances Increase
As of Sep 30, 2019, SVB Financial’s loans, net of unearned income amounted to $33.2 billion, increasing 6.8% from the prior quarter, while total deposits grew 3.7% to $61.8 billion.
Credit Quality: Mixed Bag
The ratio of net charge-offs to average gross loans was 0.18%, down 2 bps. Also, ratio of allowance for loan losses to total gross loans was 0.91%, down 8 bps year over year.
However, provision for credit losses came in at $13.2 million, up 29.6% from the prior-year quarter.
Capital & Profitability Ratios Decline
As of fourth-quarter end, CET 1 risk-based capital ratio was 12.64% compared with 13.41% at the end of prior-year quarter. Total risk-based capital ratio was 14.30% as of Dec 31, 2019, down from 14.45% on Dec 31, 2018.
Return on average assets on an annualized basis was 1.51%, down from the 1.83% recorded in the year-ago quarter. Also, return on average equity was 17.03%, decreasing from 20.61%.
2020 Outlook
Management has provided 2020 guidance based on expectations of no further changes in the Federal Funds rates.
The company projects average loan balance growth in the low-teens, while average deposit balance growth is expected to be in the mid-teens.
Additionally, NII is anticipated to be in the low single digits and NIM is projected to be 3.10-3.20%.
Further, core fee income is expected to grow in the low-double digits. Including the SVB Leerink acquisition, it is likely to increase in the high-single digits.
Non-GAAP non-interest expenses (excluding expenses related to non-controlling interests and including SVB Leerink) are projected to rise in high single digit range.
Notably, net loan charge-offs are projected to be between 0.20% and 0.40% of average total gross loans. Non-performing loans as a percentage of total gross loans are likely to be 0.30-0.50%.
The effective tax rate is expected in the range of 26-28%.
Our Viewpoint
SVB Financial remains well poised to gain from continued growth in loans and deposits. Moreover, its efforts to improve non-interest income are likely to stoke top-line growth. However, mounting non-interest expenses and lower interest rates are major near-term concerns.
SVB Financial Group Price, Consensus and EPS Surprise
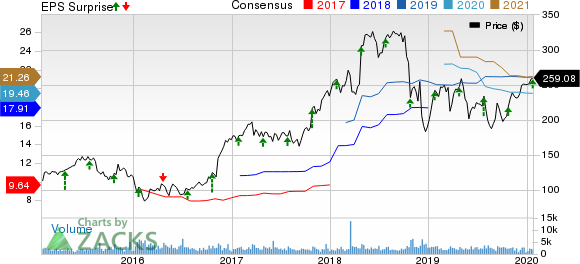
SVB Financial Group price-consensus-eps-surprise-chart | SVB Financial Group Quote
SVB Financial currently carries a Zacks Rank #3 (Hold). You can see the complete list of today’s Zacks #1 Rank (Strong Buy) stocks here.
Performance of Other Banks
Commerce Bancshares, Inc.’s CBSH fourth-quarter 2019 earnings per share of 93 cents surpassed the Zacks Consensus Estimate of 88 cents. The bottom line jumped 2.2% from the prior-year quarter.
Bank OZK’s OZK fourth-quarter 2019 earnings per share of 78 cents surpassed the Zacks Consensus Estimate of 76 cents. However, the bottom line reflects a decline of 12.4% from the prior-year quarter figure.
Hancock Whitney Corporation’s HWC fourth-quarter 2019 adjusted earnings per share of $1.06 beat the Zacks Consensus Estimate of $1.04. However, the bottom line fell 5.4% from the year-ago quarter’s reported figure.
Zacks Top 10 Stocks for 2020
In addition to the stocks discussed above, would you like to know about our 10 finest buy-and-hold tickers for the entirety of 2020?
Last year's 2019 Zacks Top 10 Stocks portfolio returned gains as high as +102.7%. Now a brand-new portfolio has been handpicked from over 4,000 companies covered by the Zacks Rank. Don’t miss your chance to get in on these long-term buys.
Access Zacks Top 10 Stocks for 2020 today >>
Want the latest recommendations from Zacks Investment Research? Today, you can download 7 Best Stocks for the Next 30 Days. Click to get this free report
Commerce Bancshares, Inc. (CBSH) : Free Stock Analysis Report
SVB Financial Group (SIVB) : Free Stock Analysis Report
Bank OZK (OZK) : Free Stock Analysis Report
Hancock Whitney Corporation (HWC) : Free Stock Analysis Report
To read this article on Zacks.com click here.
