
 Yahoo Finance
 Sunningdale Tech Ltd (SGX:BHQ): Does The -40.73% Earnings Drop Reflect A Longer Term Trend?

After looking at Sunningdale Tech Ltd’s (SGX:BHQ) latest earnings announcement (31 March 2018), I found it useful to revisit the company’s performance in the past couple of years and assess this against the most recent figures. As a long term investor, I pay close attention to earnings trend, rather than the figures published at one point in time. I also compare against an industry benchmark to check whether Sunningdale Tech’s performance has been impacted by industry movements. In this article I briefly touch on my key findings. View out our latest analysis for Sunningdale Tech
How Well Did BHQ Perform?
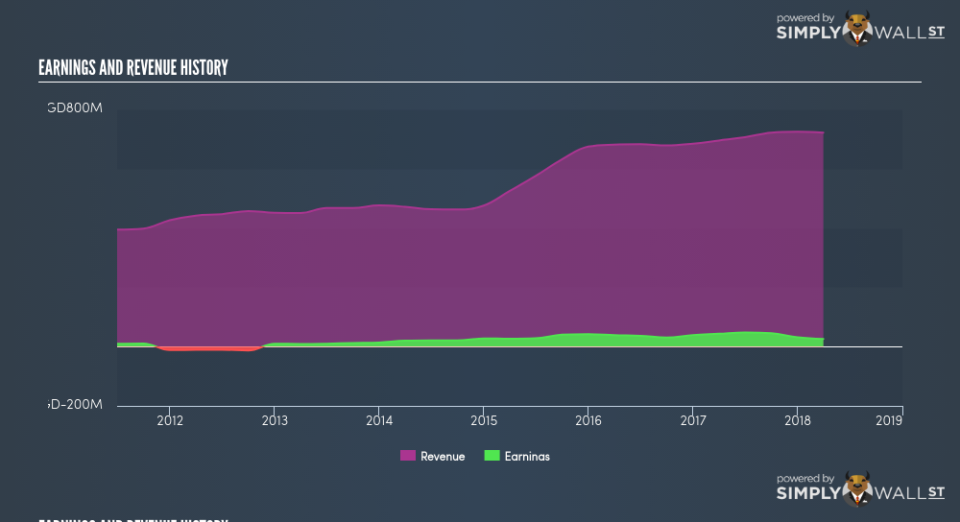
BHQ’s trailing twelve-month earnings (from 31 March 2018) of S$25.60m has declined by -40.73% compared to the previous year. Furthermore, this one-year growth rate has been lower than its average earnings growth rate over the past 5 years of 31.02%, indicating the rate at which BHQ is growing has slowed down. What could be happening here? Well, let’s take a look at what’s going on with margins and if the whole industry is feeling the heat.
In the last couple of years, revenue growth has failed to keep up which suggests that Sunningdale Tech’s bottom line has been propelled by unmaintainable cost-reductions. Eyeballing growth from a sector-level, the SG machinery industry has been enduring severe headwinds in the previous twelve months, leading to an average earnings drop of -38.19%. This is a momentous change, given that the industry has constantly been delivering a a robust growth of 12.09% in the past five years. This means that whatever recent headwind the industry is experiencing, it’s hitting Sunningdale Tech harder than its peers.
In terms of returns from investment, Sunningdale Tech has not invested its equity funds well, leading to a 6.83% return on equity (ROE), below the sensible minimum of 20%.
What does this mean?
Sunningdale Tech’s track record can be a valuable insight into its earnings performance, but it certainly doesn’t tell the whole story. Companies that are profitable, but have volatile earnings, can have many factors impacting its business. I suggest you continue to research Sunningdale Tech to get a better picture of the stock by looking at:
Future Outlook: What are well-informed industry analysts predicting for BHQ’s future growth? Take a look at our free research report of analyst consensus for BHQ’s outlook.
Financial Health: Is BHQ’s operations financially sustainable? Balance sheets can be hard to analyze, which is why we’ve done it for you. Check out our financial health checks here.
Other High-Performing Stocks: Are there other stocks that provide better prospects with proven track records? Explore our free list of these great stocks here.
NB: Figures in this article are calculated using data from the trailing twelve months from 31 March 2018. This may not be consistent with full year annual report figures.
To help readers see pass the short term volatility of the financial market, we aim to bring you a long-term focused research analysis purely driven by fundamental data. Note that our analysis does not factor in the latest price sensitive company announcements.
The author is an independent contributor and at the time of publication had no position in the stocks mentioned.
