
 Yahoo Finance
 Suncor (SU) Stock Rises 7% Since Q1 Earnings & Sales Beat
The stock of Suncor Energy SU has gone up 7.4% since its first-quarter earnings announcement on May 9.
This stock upsurge could primarily be attributed to Suncor’s first-quarter earnings and revenues beating the consensus mark.
What Did Suncor’s Earnings Unveil?
Suncor Energy reported first-quarter 2022 operating earnings of $1.52 per share, beating the Zacks Consensus Estimate of $1.31. This earnings beat could be credited to crude oil and refined product markets gaining strength in the reported quarter, prompted by a surge in energy prices.
Moreover, SU’s bottom line improved from a profit of 39 cents in the year-ago period due to a considerable gain in realizations and increased refined product sales.
Quarterly operating revenues of $10.6 billion beat the Zacks Consensus Estimate by 16% and increased by approximately 56% year over year.
In good news for investors, Suncor declared a quarterly dividend of 47 Canadian cents per share, which is an 11.9% increase from the prior dividend of 42 Canadian cents. The dividend is payable on Jun 24 to shareholders of record on Jun 3. The company also expanded its repurchase program to 10% of shares outstanding (from 7% before).
Suncor Energy Inc. Price, Consensus and EPS Surprise
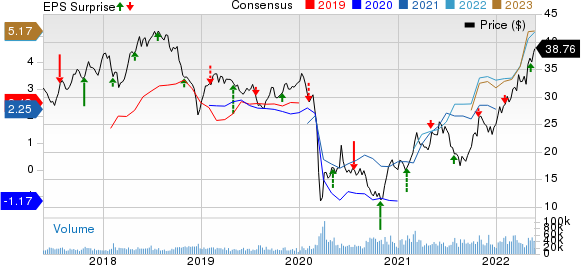
Suncor Energy Inc. price-consensus-eps-surprise-chart | Suncor Energy Inc. Quote
Segment Performance
Upstream: Suncor’s total upstream production decreased by 2.5% year over year to 766,100 barrels of oil equivalent per day (boe/d). The primary reason for this decline was the lower output from the company’s exploration and production assets (consisting of international, offshore and natural gas), which slipped to 80,400 boe/d from 95,300 boe/d a year ago.
However, significantly higher crude price realizations meant that Suncor’s upstream segment recorded adjusted operating earnings of C$2.95 billion compared with C$703 million in the prior-year quarter.
Operating costs per barrel increased to C$28.70 in the quarter under review from C$23.30 in the corresponding period of 2021. Upgrader utilization increased to 94% from 92% in the comparable quarter of the last year.
Bitumen production dropped marginally from 170,700 boe/d to 170,400 boe/d.
Oil sands volumes in the reported quarter went down to 515,300 boe/d from 519,000 boe/d in the year-ago quarter.
During the quarter, the output from Syncrude operations fell to 186,800 barrels per day (bpd) from 193,500 bpd a year earlier.
Meanwhile, Fort Hills reported average first-quarter volumes of 87,500 bpd, greater than the 51,200 bpd registered in the first quarter of 2021.
Downstream: Adjusted operating earnings from the downstream unit rose to C$1.4 billion from the year-ago figure of C$943 million, attributable to expanded margins and strong refined product sales. Suncor Energy recorded impressive refined product sales in the quarter under consideration, which increased to 551,900 bpd from the prior-year quarter figure of 548,100 bpd.
Crude throughput came in at 436,500 bpd in the first quarter of 2022, up from 428,400 bpd in the year-ago period. Moreover, refinery utilization was 94% compared with 92% a year ago.
Financial Position
Total expenses in the reported quarter climbed to C$9.65 billion from C$7.52 billion in the year-earlier period. This uptick was mainly caused by higher costs related to the purchases of crude oil and products, a rise in operating, selling and general costs and a small hike in financial expenses and exploration costs.
Suncor reported first-quarter cash flow from operating activities of C$3 billion, surging from the prior year’s C$2.34 billion. The company incurred capital expenditure worth C$1.01 billion in the quarter under discussion.
As of Mar 31, 2022, SU had cash and cash equivalents worth C$2.6 billion and carried total long-term debt of C$13.86 billion. Its total debt to total capital was 26.6%.
In the first quarter, the company distributed C$601 billion in dividends and paid out C$827 million in the form of share repurchases.
Suncor’s increased cash flows allowed it to reduce net debt by C$728 million.
Guidance
Suncor retained its guidance for production in the range of 750,000-790,000 boe/d in 2022 and refined product sales in the band of 550,000-580,000 bpd.
The company’s Fort Hills full-year production guidance stands in the range of 85,000-100,000 bpd, while for Syncrude it’s in the 175,000-190,000 bpd range.
The company now anticipates cash operating costs in its oil sands operations between C$27 and C$30 per barrel.
Suncor expects to achieve its earlier capital spending of around C$4.7 billion this year.
Finally, in the current business environment, the company expects to achieve the lower end of its 2025-targeted net debt range during the second half of 2022.
Zacks Rank
Suncor currently sports a Zacks Rank #1 (Strong Buy). You can see the complete list of today’s Zacks #1 Rank stocks here.
A Glimpse of Q1 Results of Other Energy Companies
Halliburton Company HAL reported a first-quarter 2022 adjusted net income per share of 35 cents, in line with the Zacks Consensus Estimate. The performance reflected a stronger-than-expected profit from Halliburton’s Drilling and Evaluation division.
As of Mar 31, 2022, HAL had $2.2 billion in cash/cash equivalents and $8.5 billion in long-term debt, representing a debt-to-capitalization ratio of 54.8%. The Houston-based company’s cash flow-generating capabilities and balance sheet strength should also ensure increased shareholder returns.
Range Resources Corporation RRC reported first-quarter 2022 adjusted earnings of $1.18 per share, beating the Zacks Consensus Estimate of $1.15. The strong quarterly earnings can be attributed to the higher realizations of commodity prices.
At the first-quarter end, Range Resources had total debt of $1,829.7 million. It had a debt-to-capitalization ratio of 53.3%. In the first quarter of 2022, RRC’s board of directors approved the authorization of a $500-million share repurchase program.
Matador Resources Company MTDR reported first-quarter 2022 adjusted earnings of $2.32 per share, beating the Zacks Consensus Estimate of $2.05. The strong quarterly earnings were driven by increased oil-equivalent production volumes and higher commodity price realizations.
As of Mar 31, 2022, Matador had cash and restricted cash of $120.2 million. The long-term debt was recorded at $1,498 million, including $50 million of borrowings under MTDR’s credit agreement. Debt to capitalization was 39.1%.
Want the latest recommendations from Zacks Investment Research? Today, you can download 7 Best Stocks for the Next 30 Days. Click to get this free report
Halliburton Company (HAL) : Free Stock Analysis Report
Range Resources Corporation (RRC) : Free Stock Analysis Report
Suncor Energy Inc. (SU) : Free Stock Analysis Report
Matador Resources Company (MTDR) : Free Stock Analysis Report
To read this article on Zacks.com click here.
