
 Yahoo Finance
 David Rosenberg nails the stock market with an 8-word sentence
“Nobody ever said it had to make sense.”
That’s what Gluskin Sheff’s David Rosenberg said about the stock market in a note to clients on Tuesday. He was talking about how stock prices were going up even as earnings were deteriorating.
“With two-thirds of the S&P 500 (^GSPC) having reported [Q2 financial results], earnings are on track for a 2.8% year-over-year decline on a still-soft -0.1% revenue stream,” Rosenberg said. “This all may be sequential improvement — as in, less negative — but is still contraction nonetheless for five quarters running.”
This so-called corporate earnings recession is something Yahoo Finance has been following very closely. (See here, here, here, here, here, here, here, and here.) Just a week ago, we learned that analysts had tweaked their forecasts so that this earnings recession would extend for a sixth quarter in Q3.
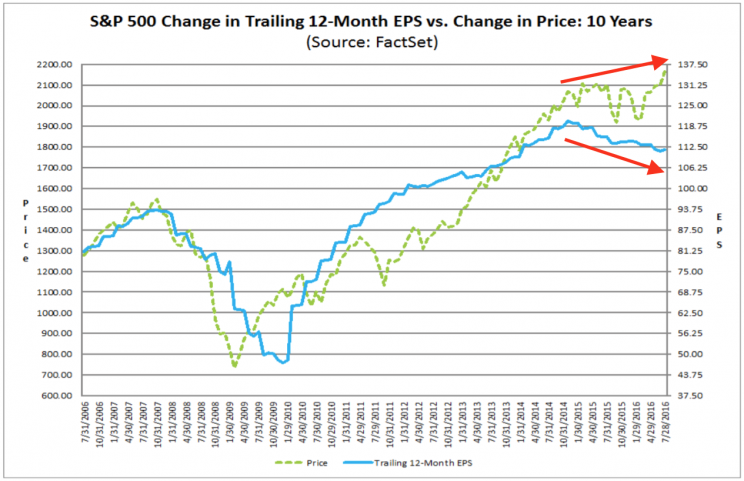
“Yet, since the earnings recession began, the stock market managed to look right through it and rally more than 20%,” Rosenberg continued. “Go figure.”
Earnings and the expectation for earnings growth are the most important drivers of stock prices. So, it’s no wonder that you have investors crying “we are totally lost.”
The stock market usually doesn’t make sense
Much has been written about the stock based on hundreds of years of observations. And in all of those volumes, we walk away with a couple of things: 1) stock prices are arguably based on some theoretical value derived from future earnings; 2) it’s very hard to calculate that theoretical value; and 3) stocks rarely trade at or near any theoretical value.
To be a bit more specific: 1) stock prices have a relationship to earnings; 2) that relationship is complicated; and 3) that relationship rarely holds.
So, while the stock market could make sense or should make sense, “nobody ever said it had to make sense.”
The stock market may make some sense in the long-run
There is some glimmer of hope for the rational investor. Studies have shown that the stock market has a tendency to revert to some long-term average value when you extend your time horizon. This is sort of reflected in the chart above, which shows that prices and earnings will head in the same direction when you zoom out.
To better understand this, we consider the price/earnings (P/E) ratio over time. When the P/E ratio is above its long-term average, stocks are considered expensive and future returns are expected to be low. When it’s below average, returns are expected to be higher.
The two charts below from JPMorgan Asset Management plot future returns based on current P/E levels. On the left, you see 1-year returns and on the right you see 5-year returns. The chaotic scattering on the left suggests the theoretical P/E relationship doesn’t really hold in the short-run. The tighter dot plot on the right suggests the relationship holds better when you extend your time horizon; this is reflected by the higher R-squared on the right.

Bank of America Merrill Lynch’s Savita Subramanian did a similar study, while illustrating her results differently. Specifically she showed how the R-squared increases with time. In other words, it shows more explicitly how P/E ratios do an increasingly better job of explaining future returns when you the more you extend your time horizon.
“Our work suggests that valuation is a poor short-term timing indicator, but the single-most important determinant of long-term returns,” Subramanian said. “Valuations have historically explained 60-90% of subsequent returns over a 10-year horizon. Normalized P/E – our preferred valuation metric – has explained 80-90% of returns over the subsequent 10-11 years.”

This is all a very long-winded way of acknowledging Rosenberg’s statement about the stock market. But while “nobody ever said it had to make sense,” it seems to make more sense if you’re willing to wait.
–
Sam Ro is managing editor at Yahoo Finance.
Read more:
Warren Buffett slams Trump with a monkey and a newspaper
The stock market is making no sense for a lot of investors
How a bad story can cripple the economy
Forecasting 2017 earnings has become Wall Street’s most controversial task
Now’s a great time to reread Warren Buffett’s op-ed he wrote after one of history’s worst sell-offs
