
 Yahoo Finance
STI Notched A 10-Year High – Time To Buy SG stocks?
By Ernest Lim
Dow has logged a seventh consecutive rise and small caps as measured by S&P600 index have just closed at a record high as of 11 May 2018.
Our Singapore market has also done us proud by becoming Asia’s best-performing equity market on 2 May 2018, after rising to a 10-year high since the financial crisis of 2008.
In view of the above, is it a screaming buy for our Singapore market, especially for small caps which have underperformed?
S&P500 Closed 2,728. Day range 2,717 – 2,733
Based on Chart 1 below, S&P500 seems to have broken above a downtrend line established since 26 January 2018 and has just breached above its recent high 2,717 on 18 April 2018. All the exponential moving averages (EMAs) have stopped their declines and are moving higher. 20D EMA has just formed a golden cross with 100D EMA but the strength of this golden cross requires time to ascertain. This is because ADX has declined to around 20.0 amid positively placed directional indicators (DIs). In my opinion, this indicates that the trend is quite weak. Indicators such as RSI and OBV have naturally strengthened with the rise in S&P500.
Overall, if S&P500 can sustain its close above 2,720, it will have negated its recent bearishness in the chart since February 2018. Given the weak ADX, S&P500 is likely to trade sideways between 2,615 – 2,800 in the near term (the range is quite big as S&P500’s average true range is around 34 points). A sustained break below 200D EMA (currently at 2,615) is bearish for the chart.
Near term supports: 2,700 / 2,671 – 2,677 / 2,645
Near term resistances: 2,741 – 2,750 / 2,766 / 2,790
Chart 1: S&P500 – Above Its Downtrend Line

Source: InvestingNote 11 May 2018
Hang Seng Index closed 31,122. Day range 31,032 – 31,277
Based on Chart 2 below, Hang Seng Index (HSI) seems to have broken the recent near-term downtrend. Nevertheless, it is still trading in a broad sideway range between 29,500 – 32,220 since early February 2018. All the EMAs have started to turn higher. DIs are positively placed but ADX is still at a low level 13.6 which indicates a lack of trend. Indicators such as RSI have gained strength recently. Based on the chart, HSI may continue to move higher to the upper end of the range around 31,800 – 32,220. However, given the low ADX, it is unlikely to have a sustained close above 32,220.
Near term supports: 30,809 / 30,363 – 30,585 / 30,178
Near term resistances: 31,440 / 31,800 / 31,978 – 32,000
Chart 2: HSI – May Move To 31,800 – 32,220

Source: InvestingNote 11 May 2018
STI Closed 3,570. Day range 3,541-3,576
Based on Chart 3 below, it is evident that STI is the strongest index among S&P500 and Hang Seng. It managed to breach its January 2018 high on 2 May 2018 with an intraday high of 3,642. All the EMAs are rising with golden cross formed last month. However, I will like to draw your attention to some noteworthy points:
1. Although STI has formed a new high on 2 May 2018 as compared to 24 Jan 2018, indicators such as MACD, MFI, OBV and RSI have formed bearish divergences;
2. ADX continues to be low at 15.3 which indicate a lack of trend.
Personally, given the low ADX and the bearish divergences exhibited by the aforementioned indicators, STI may not be able to make a sustained close above 3,642 – 3,645. In fact, it may not even make a sustained close above 3,607 – 3,611.
Near term supports: 3,546 / 3,537 / 3,517
Near term resistances: 3,588 / 3,607 – 3,611 / 3,642 – 3,645
Chart 3: STI – Face Resistance 3,607 – 3,611, Followed By 3,642 – 3,645
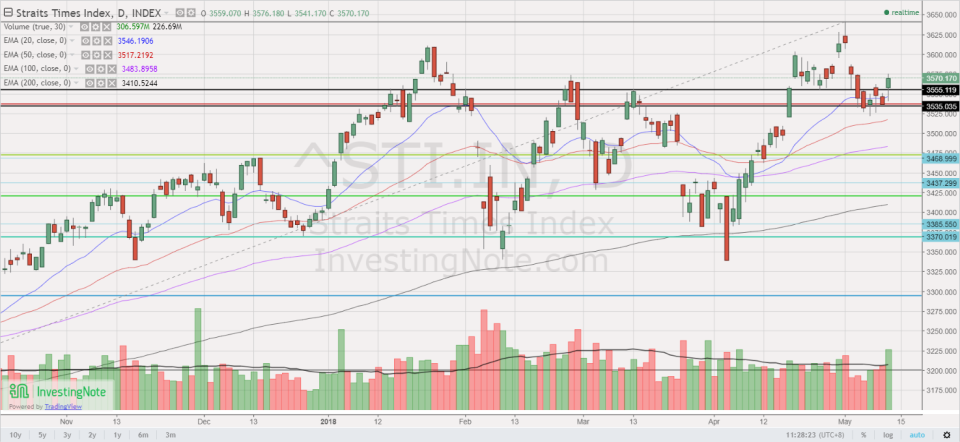
Source: InvestingNote 11 May 2018
FSTS closed 387.4. Day range 385.9 – 387.8
Based on Chart 4 below, it is evident that FTSE ST Small Cap Index (FSTS) is the weakest index among the above indices. Chart is entrenched in a downtrend since January 2018 with downward sloping EMAs and death cross formations. Although STI made another high in May, FSTS is near a one-plus year low. The break below its neckline of the double / triple top formation points to an eventual technical measured target of around 377 which has yet to be attained. One saving grace to the bearish chart is that some indicators such as MACD, MFI and RSI are showing bullish divergences. A sustained break above 393 alleviates the bearishness to some extent.
Near term supports: 385 / 383 / 379
Near term resistances: 389 / 391 – 393 / 395
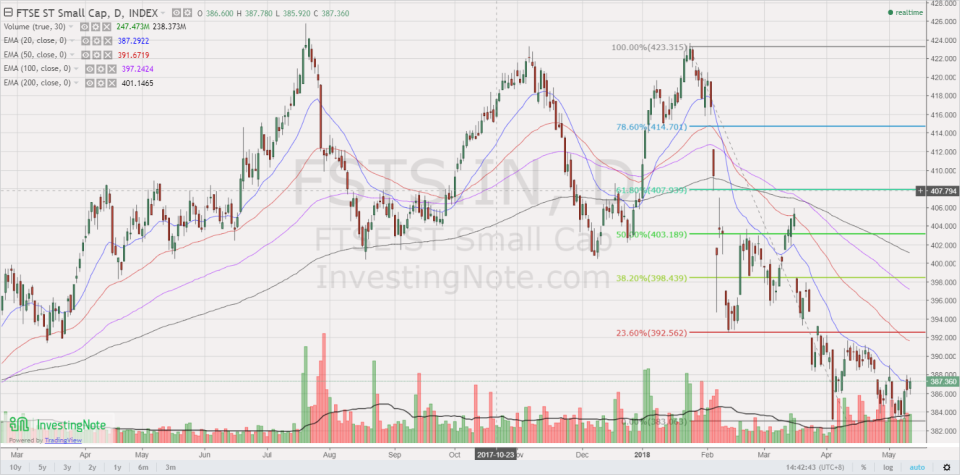
Source: InvestingNote 11 May 2018
Conclusion
Based on my personal interpretation of the above charts, viz. S&P500, Hang Seng and STI, they may have a maximum of two to three percentage points of potential upside in the near term. For myself, I have started to sell into strength last week, as I am cautious on the overall market in the next couple of months due to the below factors:
a) Most companies have already reported their results or/and dish out dividends. There are fewer catalysts to be invested at this time;
b)World Cup starts on 14 June 2018. Based on DBS’ research, they have studied the past six tournaments and concluded that STI fell an average 8.6 percent from end-April to end-June;
c)School holidays. Our Singapore market typically experiences lesser volume during long school holidays. Typically, when there is less volume, we may experience higher volatility;
d) Ongoing US-China trade talks. Although it is not in anybody’s interest to stage an all-out trade war, the ongoing negotiations may throw out an occasional temporary spanner in the works which may cause markets to weaken;
e) Tensions between US & North Korea have eased in recent weeks. However, it remains to be seen what will transpire in the meeting between President Trump and North Korean leader Kim Jong Un on 12 June 2018;
f) In the 11 mid-term election years in the US, based on a study by Goldman Sachs (see Chart 5), they noted that S&P500 typically experiences an average 15 percent volatility, compared with the median of 12 percent in all years. In other words, US mid-term election year have higher volatility;
Chart 5: Mid-term election year have higher volatility

g) Investigations by Special Counsel Robert Mueller into whether Trump campaign officials colluded with Russia’s efforts to interfere in the 2016 presidential election are still on-going. It also remains to be seen what will happen in the next few months;
h) Economic data has slowed recently. For example, US 1Q18 GDP registered 2.3 percent which was lower than 3 percent average of the previous three quarters. Some economic data have weakened of late, hence there have been concerns that the period of synchronised global growth may be approaching an end. However, there are hopes that the economic data may strengthen in the next few months. This remains to be seen;
i) Inflation is likely to rise over the course of 2018. Markets are likely to pay more attention to the rate of increase as they are worried that the US Fed may be behind the curve, or they act prematurely;
j) Fed meeting on 12 – 13 June and markets are pricing in for a rate hike. Attention will be focused on their FOMC statement and FOMC press conference;
k) More Wall Street firms are cautious in the equity market. Goldman Sachs just raised “cash” as an asset class to overweight with a horizon of 3 months, to reduce portfolio risk;
l) Although STI has reached an intraday high of 3,642 on 2 May 2018 which is also a ten year high, it is noteworthy that STI’s recent surge was mainly propelled by our three local banks which altogether constitute approximately 40 percent weightage in the STI (click HERE for the weightage). In other words, the rally is not a broad base rally. Recently, some IPOs such as Summit Power and Qualitas have shelved their IPO plans on our Singapore stock exchange due likely (my guess) to tepid demand for their shares. In other words, our Singapore market is not as strong as what STI is reflecting.
P.S: Do note the above list of factors is not exhaustive and its my own personal view. To be clear, I remain positive on stocks over the medium term. However, I am just cautious in the next couple of months as I believe I may have a better entry level in the next couple of months.
In view of the above, I have already started to sell into strength last week and have reduced my invested capital to below 50 percent. Below is my *trading plan for the next couple of months:
a) Accumulate small mid cap stocks with potential near-term catalysts on weakness (e.g. if they reported poor one off results with unchanged positive long term views etc). I have and will continue to share with my clients on my portfolio actions and some trading / investing ideas;
b) I may use CFD or cash to accumulate some blue-chip stocks either in Singapore, or Hong Kong, or Malaysia on weakness;
c) I may switch out some of my stocks to enter other stocks, should other compelling opportunities arise.
*Naturally, my market outlook and trading plan are subject to change as charts develop. My plan will likely not be suitable to most people as everybody is different. I do not know whether markets will definitely rebound, or continue to drop. However, I am acting according to my plans. In other words, my market outlook; portfolio management; actual actions are in-line with one other. Notwithstanding this, everybody is different and hence readers / clients should exercise their independent judgement and carefully consider their percentage invested, returns expectation, risk profile, current market developments, personal market outlook etc. and make their own independent decisions.
Readers who wish to be notified of my write-ups and / or informative emails, can consider signing up at http://ernest15percent.com. However, this reader’s mailing list has a one or two-day lag time as I will (naturally) send information (more information, more emails with more details) to my clients first. For readers who wish to enquire on being my client, they can consider leaving their contacts here http://ernest15percent.com/index.php/about-me/
P.S: Do note that as I am a full time remisier, I can change my trading plan fast to capitalize on the markets’ movements.
Disclaimer
Please refer to the disclaimer HERE
