
 Yahoo Finance
 SINA Corp.'s (SINA) Q4 Earnings and Revenues Increase Y/Y
SINA Corporation SINA reported fourth-quarter 2019 non-GAAP earnings of $1.17 per share, beating the Zacks Consensus Estimate by 185.4%. The figure also increased 46.3% from the year-ago quarter.
Non-GAAP net revenues increased 4% year over year to $590.7 million. At constant currency (cc), non-GAAP revenues increased 5% year over year. The Zacks Consensus Estimate for revenues was pegged at $561 million.
Quarter Details
Advertising revenues (77.7% of revenues) decreased 4.8% year over year to $460.8 million due to decline in Weibo and portal advertising revenues.
Non-advertising revenues (22.3% of total revenues) climbed 49.3% year over year (up 51% at cc) to $129.8 million. This upside was driven by higher revenues generated from the company’s fin-tech businesses.
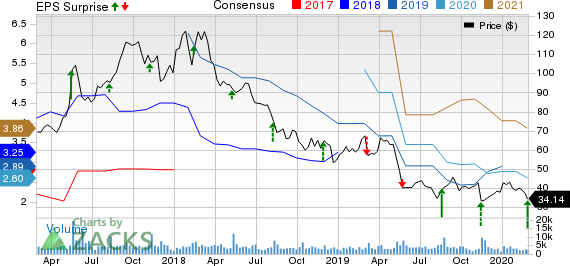
Sina Corporation Price, Consensus and EPS Surprise
Sina Corporation price-consensus-eps-surprise-chart | Sina Corporation Quote
Revenues from the Weibo business decreased 2.9% year over year to $468.2 million. Notably, Weibo’s user community base surpassed 500 million with EMEA reaching 560 million in December 2019, adding around 54 million users on a year-over-year basis. Average daily active users (DAUs) reached 222 million in December 2019.
Weibo’s advertising & marketing revenues were down 2.7% year over year (down 1% at cc) to $405.9 million. Weibo’s VAS revenues declined 4% to $62.2 million.
Weibo’s key accounts business decreased 7% (down 6% at cc) due to reduction of handset shipments, which negatively impacted key accounts growth in the reported quarter.
Revenues from the portal business increased 41.7% year over year to $134.2 million. Portal advertising revenues decreased 16.2% year over year to $56.5 million due to lower ad spending by SME customer as well as certain brand industries such as automobile and Internet services.
Other revenues increased to $77.7 million from $27.3 million reported in the year-ago quarter.
Operating Details
SINA reported fourth-quarter non-GAAP gross profit of $457.7 million, up 2.1% year over year. Non-GAAP gross margin of 77.2% contracted 109 basis points (bps) on a year-over-year basis.
Non-GAAP advertising gross margin shrunk 100 bps to 82%. Non-GAAP non-advertising gross margin was 63%, up from the year-ago quarter’s 56%, benefiting from better gross margin profile of SINA’s fintech business.
Sales and marketing expenses were $165.4 million, down 13.5% year over year. However, general and administrative expenses increased to $177.4 million from $30.63 million reported in the year-ago quarter. Moreover, product development expenses were $95.6 million, reflecting an increase of 12%.
Operating expenses (47.7% of revenues) on a non-GAAP basis came in at $282.8 million, down 2% year over year.
Non-GAAP operating income was $174.9 million, up 9.5% year over year. Non-GAAP operating margin of 29.4% expanded 160 bps year over year.
On Dec 31, 2019, SINA board of directors authorized a share repurchase program per which the company may repurchase up to $500 million of its ordinary shares over the next 12 months.
Balance Sheet and Cash Flow
As of Dec 31, 2019, SINA's cash, cash equivalents and short-term investments were $2.9 billion, which remained flat on a sequential basis.
While net cash provided by operating activities was $301.7 million in the fourth quarter, capital expenditures totaled $8.5 million.
Zacks Rank & Stocks to Consider
Currently, SINA carries a Zacks Rank #5 (Strong Sell).
Some better-ranked stocks in the broader technology sector include Dropbox, Inc. DBX , Stamps.com Inc. STMP and ManTech International Corporation MANT, each sporting a Zacks Rank #1 (Strong Buy), at present. You can see the complete list of today’s Zacks #1 Rank stocks here.
The long-term earnings growth rate for Dropbox, Stamps.com and ManTech is currently projected to be 22.2%, 15% and 8%, respectively.
Today's Best Stocks from Zacks
Would you like to see the updated picks from our best market-beating strategies? From 2017 through 2019, while the S&P 500 gained and impressive +53.6%, five of our strategies returned +65.8%, +97.1%, +118.0%, +175.7% and even +186.7%.
This outperformance has not just been a recent phenomenon. From 2000 – 2019, while the S&P averaged +6.0% per year, our top strategies averaged up to +54.7% per year.
See their latest picks free >>
Want the latest recommendations from Zacks Investment Research? Today, you can download 7 Best Stocks for the Next 30 Days. Click to get this free report
Sina Corporation (SINA) : Free Stock Analysis Report
ManTech International Corporation (MANT) : Free Stock Analysis Report
Stamps.com Inc. (STMP) : Free Stock Analysis Report
Dropbox, Inc. (DBX) : Free Stock Analysis Report
To read this article on Zacks.com click here.
Zacks Investment Research
