
 Yahoo Finance
 SINA Corp.'s (SINA) Q1 Earnings Beat, Revenues Decline Y/Y
SINA Corporation SINA reported first-quarter 2020 non-GAAP earnings of 25 cents per share, which beat the Zacks Consensus Estimate by 78.6%. However, the figure decreased 37.5% from the year-ago quarter.
Non-GAAP net revenues decreased 8% year over year to $432.4 million. At constant currency (cc), non-GAAP revenues decreased 4% year over year. The Zacks Consensus Estimate for revenues was pegged at $383 million.
Quarter Details
Advertising revenues (71.2% of revenues) decreased 20.1% year over year (down 16% at cc) to $310 million primarily due to the adverse impact of the coronavirus pandemic on overall advertising demand as well as negative currency translation impact.
Non-advertising revenues (28.8% of total revenues) climbed 43.5% year over year (up 51% at cc) to $129.8 million. This upside was driven by higher revenues generated from the company’s fin-tech businesses.
Sina Corporation Price, Consensus and EPS Surprise
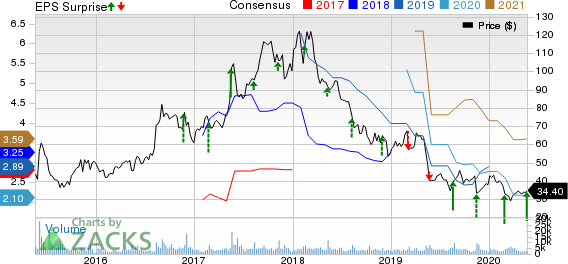
Sina Corporation price-consensus-eps-surprise-chart | Sina Corporation Quote
Revenues from the Weibo business decreased 18.9% year over year to $323.4 million. In March, Weibo’s average daily active users (DAUs) reached 241 million, up approximately 30 million users year over year. Monthly active users (MAUs) were 515 million, up approximately 85 million users year over year.
Weibo’s advertising & marketing revenues were down 19.3% year over year (down 16% at cc) to $275.4 million. Weibo’s VAS revenues declined 17.3% to $47.9 million.
Weibo’s key accounts business decreased 24% (down 21% at cc) as advertisers from various industries had canceled or suspended marketing campaigns in the wake of the virus outbreak since late January.
Revenues from the Non-Weibo business increased 44.6% year over year to $118.3 million. Media advertising revenues decreased 21.7% year over year (down 18% at cc) to $36.6 million due to lower ad spending by SME customers.
SINA’s Fintech revenues increased 133.84% from the year-ago quarter to $81.65 million.
Fintech includes Fintech services and SINA Media other businesses. For the first quarter of 2020, SINA Media other revenues were $3.9 million, down 39.1% from the year-ago quarter.
In the first quarter, average DAU of SINA News app and SINA Finance app grew around 49% and 158%, respectively on a year-over-year basis.
Operating Details
SINA reported first-quarter non-GAAP gross profit of $288.8 million, down 19.6% year over year. Non-GAAP gross margin of 66.3% contracted from 75.6% in the year-ago quarter.
Non-GAAP advertising gross margin shrunk 300 bps to 76%. Non-GAAP non-advertising gross margin was 43%, down from the year-ago quarter’s 63%.
Sales and marketing expenses were $127.6 million, down 12.5% year over year. Moreover, product development expenses were $91.9 million, reflecting a decrease of 2.2%. However, general and administrative expenses increased 16.7% year over year to $38.7 million.
Operating expenses (53.2% of revenues) on a non-GAAP basis were $231.6 million, down 5.5% year over year.
Non-GAAP operating income was $57.1 million, down 50% year over year. Non-GAAP operating margin of 13.1% contracted from 24% in the year-ago quarter.
As of Mar 31, 2020, the company repurchased approximately 3.2 million shares at an average cost of $30.59 under the 2020 New Program. There were 65,384,161 ordinary shares outstanding as of Mar 31, 2020.
Balance Sheet and Cash Flow
As of Mar 31, 2020, SINA's cash, cash equivalents and short-term investments totaled $2.7 billion, compared with $2.9 billion as of Dec 31, 2019.
While net cash provided by operating activities was $77.3 million in the first quarter, capital expenditures totaled $11.1 million.
Zacks Rank & Other Stocks to Consider
Currently, SINA sports a Zacks Rank #1 (Strong Buy).
NVIDIA Corporation NVDA, Workday Inc. WDAY and Okta Inc. OKTA are some other top-ranked stocks in the broader computer and technology sector. All three stocks carry a Zacks Rank #2 (Buy). You can see the complete list of today’s Zacks #1 Rank stocks here.
NVIDIA, Workday and Okta are set to report quarterly results on May 21, 26 and 28, respectively.
Looking for Stocks with Skyrocketing Upside?
Zacks has just released a Special Report on the booming investment opportunities of legal marijuana.
Ignited by new referendums and legislation, this industry is expected to blast from an already robust $6.7 billion to $20.2 billion in 2021. Early investors stand to make a killing, but you have to be ready to act and know just where to look.
See the pot trades we're targeting>>
Want the latest recommendations from Zacks Investment Research? Today, you can download 7 Best Stocks for the Next 30 Days. Click to get this free report
NVIDIA Corporation (NVDA) : Free Stock Analysis Report
Sina Corporation (SINA) : Free Stock Analysis Report
Workday, Inc. (WDAY) : Free Stock Analysis Report
Okta, Inc. (OKTA) : Free Stock Analysis Report
To read this article on Zacks.com click here.
Zacks Investment Research
