
 Yahoo Finance
 SINA Up 2.8% Since Earnings Report: Can It Continue?

It has been about a month since the last earnings report for Sina Corporation SINA. Shares have added about 2.8% in that time frame.
Will the recent positive trend continue leading up to its next earnings release, or is SINA due for a pullback? Before we dive into how investors and analysts have reacted as of late, let's take a quick look at the most recent earnings report in order to get a better handle on the important drivers.
Recent Earnings
SINA’s first-quarter 2018 non-GAAP earnings of 47 cents per share beat the Zacks Consensus Estimate by a couple of cents but declined 3 cents from the year-ago quarter.
Net revenues grew 59% to $441 million and beat the Zacks Consensus Estimate of $440 million. Non-GAAP net revenues also grew 59% to $438.1 million.
Quarter Details
Advertising revenues surged 61% year over year to $367.1 million, driven by the momentum in the Weibo segment. Non-advertising (non GAAP) revenues increased 50% year over year to $71.1 million driven by growth in fintech business as well as increased revenues from Weibo gaming and membership.
Revenues from Weibo business surged 75.6% year over year to $349.8 million. Weibo non-ad revenues grew 57% to $46.9 million on the back of increased membership and gaming revenues.
Weibo's ad and marketing revenues grew 79% to $302.9 million in the reported quarter. Monthly active users increased 20.7% from the year-ago quarter to 411 million, driven by an increasing number of mobile users. At the end of the quarter, daily active users went up to 184 million, up 19.5% from the year-ago quarter.
Portal advertising revenues were up 7% year over year to $64.1 million driven by increased mobile transition and monetization. Mobile app revenues for portal accounted for 77% of total portal ad revenues compared with 53% in the year-ago quarter. The upside is attributed to growth in mobile traffic for SINA News and Finance applications. Daily Active Users for News app and Finance app increased 31% and 40%, respectively.
Portal non-advertising revenues increased 38% to $24.1 million. However, stricter regulation in micro-lending sector continues to remain an overhang.
Margins
Non-GAAP operating income was $94.6 million, which surged 49% year over year. However, non-GAAP operating margin of 22% declined 100 basis points from the year-ago quarter.
Increase in sales and marketing expenses to increase Weibo and SINA news app users and a rise in product development cost remain dampeners.
Balance Sheet and Cash Flow
SINA exited the quarter with cash & cash equivalents (including short-term investments & restricted cash) of $3.64 billion compared with $3.59 billion as of Dec 31, 2017.
Cash provided by operating activities in the quarter was $54.9 million. Capital expenditure was $36.2 million.
How Have Estimates Been Moving Since Then?
It turns out, fresh estimates have trended downward during the past month. There have been two revisions lower for the current quarter.
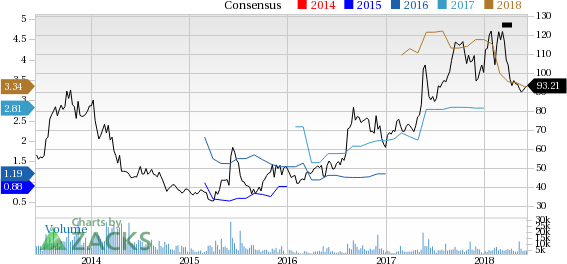
Sina Corporation Price and Consensus
Sina Corporation Price and Consensus | Sina Corporation Quote
VGM Scores
At this time, SINA has a poor Growth Score of F, however its Momentum is doing a bit better with a D. The stock was also allocated a grade of D on the value side, putting it in the bottom 40% for this investment strategy.
Overall, the stock has an aggregate VGM Score of F. If you aren't focused on one strategy, this score is the one you should be interested in.
Our style scores indicate investors will probably be better served looking elsewhere.
Outlook
Estimates have been broadly trending downward for the stock and the magnitude of these revisions indicates a downward shift. Interestingly, SINA has a Zacks Rank #3 (Hold). We expect an in-line return from the stock in the next few months.
Want the latest recommendations from Zacks Investment Research? Today, you can download 7 Best Stocks for the Next 30 Days. Click to get this free report
Sina Corporation (SINA) : Free Stock Analysis Report
To read this article on Zacks.com click here.
Zacks Investment Research
