
 Yahoo Finance
 Is Silicom Ltd’s (NASDAQ:SILC) ROE Of 12.64% Sustainable?

This analysis is intended to introduce important early concepts to people who are starting to invest and want a simplistic look at the return on Silicom Ltd (NASDAQ:SILC) stock.
Silicom Ltd (NASDAQ:SILC) outperformed the Communications Equipment industry on the basis of its ROE – producing a higher 12.64% relative to the peer average of 7.99% over the past 12 months. Superficially, this looks great since we know that SILC has generated big profits with little equity capital; however, ROE doesn’t tell us how much SILC has borrowed in debt. We’ll take a closer look today at factors like financial leverage to determine whether SILC’s ROE is actually sustainable. View out our latest analysis for Silicom
What you must know about ROE
Return on Equity (ROE) is a measure of Silicom’s profit relative to its shareholders’ equity. It essentially shows how much the company can generate in earnings given the amount of equity it has raised. While a higher ROE is preferred in most cases, there are several other factors we should consider before drawing any conclusions.
Return on Equity = Net Profit ÷ Shareholders Equity
ROE is assessed against cost of equity, which is measured using the Capital Asset Pricing Model (CAPM) – but let’s not dive into the details of that today. For now, let’s just look at the cost of equity number for Silicom, which is 9.30%. Given a positive discrepancy of 3.34% between return and cost, this indicates that Silicom pays less for its capital than what it generates in return, which is a sign of capital efficiency. ROE can be dissected into three distinct ratios: net profit margin, asset turnover, and financial leverage. This is called the Dupont Formula:
Dupont Formula
ROE = profit margin × asset turnover × financial leverage
ROE = (annual net profit ÷ sales) × (sales ÷ assets) × (assets ÷ shareholders’ equity)
ROE = annual net profit ÷ shareholders’ equity

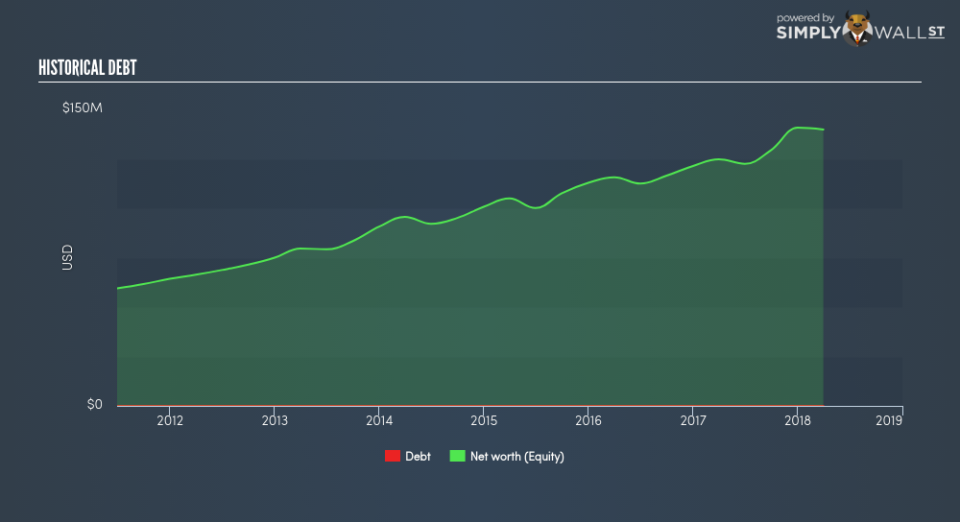
Essentially, profit margin shows how much money the company makes after paying for all its expenses. Asset turnover shows how much revenue Silicom can generate with its current asset base. And finally, financial leverage is simply how much of assets are funded by equity, which exhibits how sustainable the company’s capital structure is. Since financial leverage can artificially inflate ROE, we need to look at how much debt Silicom currently has. Currently, Silicom has no debt which means its returns are driven purely by equity capital. Therefore, the level of financial leverage has no impact on ROE, and the ratio is a representative measure of the efficiency of all its capital employed firm-wide.
Next Steps:
ROE is one of many ratios which meaningfully dissects financial statements, which illustrates the quality of a company. Silicom’s ROE is impressive relative to the industry average and also covers its cost of equity. Its high ROE is not likely to be driven by high debt. Therefore, investors may have more confidence in the sustainability of this level of returns going forward. Although ROE can be a useful metric, it is only a small part of diligent research.
For Silicom, there are three relevant factors you should further examine:
Financial Health: Does it have a healthy balance sheet? Take a look at our free balance sheet analysis with six simple checks on key factors like leverage and risk.
Management:Have insiders been ramping up their shares to take advantage of the market’s sentiment for Silicom’s future outlook? Check out our management and board analysis with insights on CEO compensation and governance factors.
Other High-Growth Alternatives : Are there other high-growth stocks you could be holding instead of Silicom? Explore our interactive list of stocks with large growth potential to get an idea of what else is out there you may be missing!
To help readers see pass the short term volatility of the financial market, we aim to bring you a long-term focused research analysis purely driven by fundamental data. Note that our analysis does not factor in the latest price sensitive company announcements.
The author is an independent contributor and at the time of publication had no position in the stocks mentioned.
