SI Technical Analysis: Where Is Best World Going?
17 August 2017, the share price of Best World International Limited (SGX: CGN) is sliding again!
As a follow up to CoffeeTalk’s article on this company, we have decided to give our views from a charting angle. Is this company still worth buying or do we wait for another opportunity?
Technical Analysis entails predicting the future direction of the share price of a company by looking at the charts but, here at Shares Investment, we are more inclined towards looking at first, the fundamentals, before looking at it from a technical angle.
Having said that, we do agree with CoffeeTalk that Best World continues to be on our “like” list.
We do not think that it has committed wrongdoings, and this correction is simply caused by investors pressing the panic button as a result of the pyramid selling scheme practised by a non-licensed, shady player in the PRC.
Double-top formation
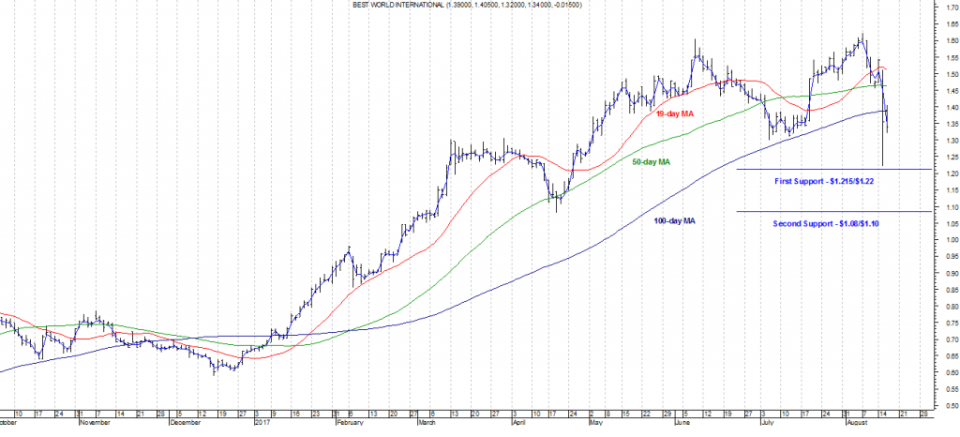
There is an obvious double-top formation in the chart pattern of Best World. When we say double top, it simply means that there is a twin peak seen on the chart and this means that a correction is imminent.
Plain enough to see, the first peak was formed in early June 2017 when the price peaked at $1.605 while the second peak was formed on 7 August 2017 at $1.62. Following the first peak, the price correction was gradual but the correction after 7 August 2017, which is the second peak, is way too aggressive for anyone’s liking.
The share price fell to as low as $1.22 on 15 August before closing at $1.355 after the company clarified that it is not involved in the PRC scam while its business model is still intact. The following day on 16 August, the share price recovered to as high as $1.405 before closing at $1.34 – near the day low of $1.32.
The correction, however, broke through the support zone of $1.30-$1.385, meaning that the next key support can only be found near $1.08-$1.10.
Testing new support of $1.215-$1.22
The share price formed a recent low at $1.22 on 15 August 2017 followed by another test of this new support level on 17 August 2017 when it traded as low as $1.215. While there are now fresh developments, Best World’s share price will continue to get hit by panic sellers and, probably, receive attention from short sellers during this period.
If the share price of Best World can hold onto the $1.215-$1.22 support (incidentally also near the Fibonacci Retracement of 50%) on dwindling volume, then we can safely call that a bottom has been found.
If $1.215-$1.22 does not hold, we hold the view that $1.08-$1.10 (also Fibonacci Retracement of 61.7%) is the next likely support level that will attract bargain hunters.
Moving Average (MA) supports
While the moving-average supports of 19-day, 50-day and 100-day have been breached, we have yet to experience a significant death cross whereby the shorter MA cut the longer MA from above. In the short-term, resistance formed by the MA can be found at $1.40 (100-day) and $1.45 (50-day).
Unless some positive developments occur, we do not see the possibility of a strong rebound above $1.40-$1.45.
As mentioned, buyers will probably come in droves at $1.08-$1.10 so be very careful in trading a downward-trending stock that is tantamount to trying to catch a falling knife.

 Yahoo Finance

