
 Yahoo Finance
SI Research: Is it Time To Buy Into Frencken Group’s Comeback?
Since US President Donald Trump initiated the trade war with China in March 2018, Singapore stocks, especially those in the technology and manufacturing sector, have taken a significant hit. The mainboard-listed technology solutions provider Frencken Group (Frencken) was no exception.
The share price of Frencken was battered in 2018 due to the rising trade tensions and cyclically slower demand conditions in the global technology industry. After closing 2018 at $0.42, shares of Frencken have rallied to $0.675 to register a year-to-date return of 60.7 percent as at 17 April 2019 on the back of a possible trade resolution.
Despite a challenging 2018, Frencken reported a rather solid FY18 and had recently been receiving rather positive recommendations from the street. Is it time to buy into Frencken?
Diversified Business
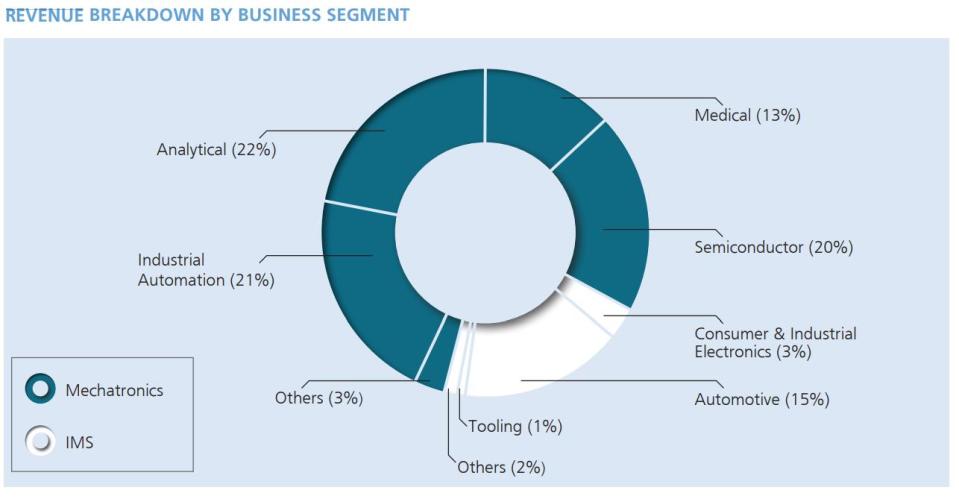
Frencken, formerly known as ElectroTech Investments Limited, is a global integrated technology solution provider. Frencken operates under two main divisions, namely Mechatronics and Integrated Manufacturing Services (IMS).
Source: Company’s Annual Report
Mechatronics division designs and manufactures high precision and complex systems for original equipment manufacturers (OEM) in the healthcare, life sciences, semiconductor and industrial automation markets. On the other hand, IMS division provides integrated contract design and manufacturing services to the automotive as well as consumer and industrial electronics segments.
Currently, Frencken has 16 operating sites across Asia, Europe and the USA. Out of 16 sites, there are only three operating sites located in China in which Frencken will have no urgent need to diversify out of China on the back of trade tension.
In terms of customer base, Frencken has a diversified blue chip customer base located globally, with about 50.9 percent from Asia ( 13 percent from China), 42.4 percent from Europe, 4.9 percent from USA and the remaining 1.8 percent from other regions, based on FY18 revenue.
The diversified revenue base, location of manufacturing facilities and customer base helps Frencken to buffer any adverse impact from a cyclical slowdown of a particular industry and in turn brings resilience and stability to the group.
Stellar Financial Performances
$’million | FY18 | FY17 | FY16 | FY15 | FY14 | FY13 |
Revenue | 625.8 | 515.1 | 466.4 | 439.4 | 472.7 | 444.7 |
Gross Profit | 101.7 | 83.9 | 70.8 | 67.3 | 66.0 | 66.9 |
Gross Margin | 16.3% | 16.3% | 15.2% | 15.3% | 14.0% | 15.1% |
Exceptional Items | -3.9 | 10.5 | 0.0 | -6.0 | -0.7 | -0.4 |
Net Profit (including exceptional items) | 30.0 | 33.4 | 15.9 | 9.2 | 11.4 | 17.7 |
Net Profit (excluding exceptional items) | 33.9 | 23.0 | 15.9 | 15.2 | 12.1 | 18.1 |
Frencken’s strong performance for FY18 was largely driven by the Mechatronics division, which accounted for 79.4 percent of its revenue. The revenue from Mechatronics division jumped 33.1 percent to $496.8 million primarily due to industrial automation segment which was boosted by increased orders for storage drive production equipment from a key customer. On the other hand, the revenue from IMS division fell 9.1% to $128.7 million due to the absence of contribution from divested Precico Electronics Sdn. Bhd. (PESB).
In tandem with higher revenue, gross profit rose 21.3% to $101.7 million as gross margin remains stable at 16.3 percent due to higher utilisation of production capacity. Excluding the exceptional items, net profit grew 47.7 percent to a record $33.9 million.
Over the past five years, Frencken displayed a remarkable growth with its revenue expanding at a compound annual growth rate (CAGR) of 7.1 percent to $625.8 million in FY18. Likewise, net profit excluding exceptional items also improved at an impressive CAGR of 13.3 percent to $33.9 million.
Comfortable Balance Sheet
As at 31 December 2018, Frencken’s cash and bank balances stood at $67.1 million against total borrowings of $68.7 million. This translates to a net debt position of $1.6 million. However, the total-debt-to-equity ratio only stood at 0.26 times with a mere long-term debt of $1.2 million and shareholder’s equity worth of $264.9 million. Even though the bulk of the total borrowings are short-term debt, Frencken is also very liquid in the near term, with a current ratio of 1.8.
Adding to this, management declared a final dividend of $0.0214 per share for FY18. At the closing price of $0.675, this translates to a decent dividend yield of 3.2 percent. Even though Frencken has no formal dividend policy, the management has been consistently rewarding shareholders with a dividend payout ratio of 30 percent. The group even paid a $0.005 dividend despite incurring net loss in FY12 post-Juken acquisition. Nonetheless, we believe that the dividend payout is sustainable with its rich cash flow generation ability owing to its diversified business nature, even in challenging economic cycles.
Inexpensive Valuation
Peer Comparison | Stock Price ($) | Market Cap ($M) | P/E Ratio | P/B Ratio | Dividend Yield (%) |
Frencken | 0.65 | 276.9 | 9.2 | 1.0 | 3.3 |
Venture | 19.19 | 5539.0 | 16.4 | 2.4 | 2.6 |
AEM Holdings | 1.08 | 295.3 | 8.8 | 3.3 | 1.8 |
CEI Limited | 0.97 | 84.1 | 11.3 | 2.1 | 1.5 |
Fu Yu Corp | 0.21 | 165.7 | 14.0 | 1.0 | 7.3 |
Grand Venture | 0.24 | 56.2 | 9.0 | 2.8 | – |
Memtech International | 0.97 | 136.6 | 10.6 | 0.8 | 3.1 |
Sunningdale Tech | 1.34 | 253.6 | 8.5 | 0.7 | 6.0 |
Riverstone | 1.12 | 830.0 | 19.6 | 3.6 | 2.1 |
UMS Holdings | 0.73 | 386.2 | 9.0 | 1.7 | 6.2 |
Valuetronics | 0.69 | 299.0 | 8.6 | 1.6 | 1.3 |
Average | 11.4 | 1.9 | 3.5 |
Source: Bloomberg (as at 18 April 2019)
At $0.65 per share, Frencken is currently trading at its book value and 9.2 times earnings Comparatively, we observe that the current valuation appears to be undemanding whether in terms of P/E or P/B in comparison to the domestic industry average. On top of that, an average target price of $0.825 from two brokerage firms still implies a further potential upside of another 22.2 percent.
Frencken is in a sweet spot with its exposure to higher growth segments, especially in Analytical, Industrial as well as Medical. The advancement of technology like data analytics and Internet of Things (IoT) such as rising trends of electric cars and smart Wi-Fi systems will help to further drive the demand for high-tech products to improve efficiencies and raise productivity.
That said, we believe that Frencken is an investment-worthy candidate that could add stability to one’s portfolio, in view of the group’s diversified business coupled with a comfortable balance sheet and a decent dividend payout.
