
 Yahoo Finance
SI Research : 5 Reasons Not To Buy Stocks Now
Underpinned by strong earnings from the electronics sector and the three local banks this year, Singapore’s Straits Times Index (STI) has delivered a remarkable year-to-date return of 19.9 percent as at 11 December 2017. However, it still lagged behind the performances of other major indices worldwide. Dow Jones Industrial Average, for instance, has not only surpassed its historical high in 2007 before the sub-prime crisis, but has continued to chart new highs. In comparison, the local benchmark is still about a hundred points shy of the previous high in April 2015 at 3,539.95, let alone talking about breaking STI’s 2007 peak above 3,800. This led some optimistic investor to believe that current bullish momentum still has more room to go as the STI plays catch-up to its regional peers. Nevertheless, I do have some reservations and hence will not be adding on more stocks to my portfolio now. Let me share with you why.

Source: Author’s Own Compilation, updated 11 December 2017
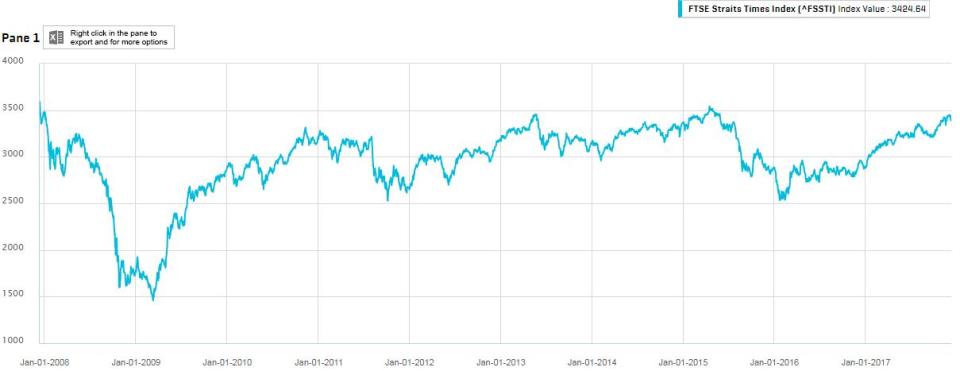
STI Already At A Relatively High Level
STI charted a historical high of 3,805.70 in October 2007 and plunged to a low of 1,456.95 in March 2009 in the midst of the US sub-prime crisis. Using these two critical values as pivotal points, at current level of 3,460.45 we have already recovered more than 85.3 percent of the fall. Does STI has the strength to continue to advance pass the 2007 high? Perhaps it can, I do not know. But what is certain is that STI at current level is definitely not in the bargain region now. Statistically speaking, the risk of a correction is more than the potential upside. As such, waiting for a better opportunity for entry will therefore be a more appropriate approach.
Source: S&P Capital IQ
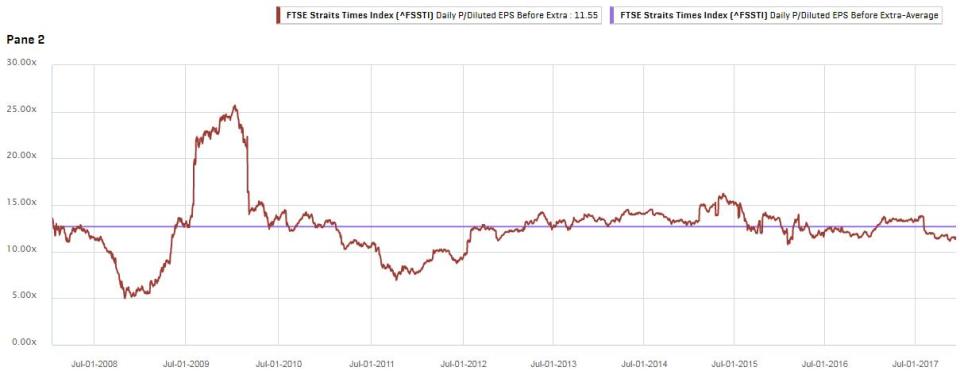
Average Earnings Multiple
STI’s valuation in terms of Price-to-Earnings (P/E) ratio is near average and not really attractive. Over the last 10 years, STI’s P/E ratio fluctuated within a range from a high of 25.7 times to a low of 5 times, with an average at 12.7 times. At current P/E ratio of 11.6 times, STI is slightly below average at approximately 31.7 percent of the range in the undervalued region. Statistically it is also in the space between negative one-time standard deviation and the average line.
Source: S&P Capital IQ
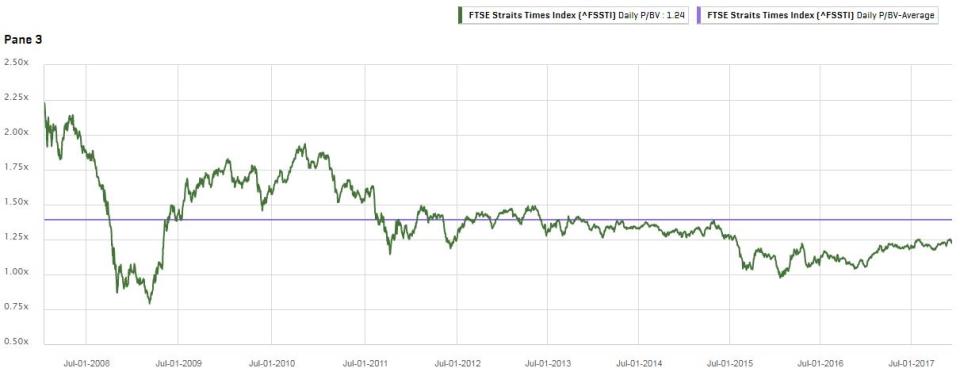
Price-to-Book Below Average
STI’s price-to-book (P/B) ratio, on the other hand, looks cheap though. At current P/B ratio of 1.2 times, it is slightly below last 10 years’ average of 1.4 times. The P/B ratio over the last 10 years oscillated between a low of 0.8 times and a high of 2.2 times. STI’s current P/B ratio stood at approximately 31.3 percent towards the undervalued range, and is in the region between the average line and negative one standard deviation of the last 10 years’ data.
Source: S&P Capital IQ
Unappealing Yield
Using SPDR STI Exchange-Traded Fund (ETF) as a proxy to determine the dividend return of our local benchmark, we calculate its yield based on the full-year dividend payout over its last market close of that year. The dividend yield of the STI ETF varied between a high of 6.5 percent in year 2008 and a low of 1.8 percent in 2010. Current distribution yield of STI ETF at 2.9 percent fell below the average yield of 3.2 percent over the last 10 years. Moreover, using Singapore Saving Bonds January 2018 issues’ average return per year of 2.13 percent over the next 10 year as the reference for risk-free rate, STI ETF’s risk premium of merely 77 basis points do not really justify the additional risk of investing in equities at this moment.

Source: Author’s Own Compilation
Another Rate Hike Is Just Round The Corner
The jobs reports released last Friday revealed that the US economy remained strong, which suggested the heightened possibility of an additional interest rate hike in the upcoming Fed’s policy meeting. Together with Fed’s plans to shrink balance sheet, uncertainties surrounding Brexit, escalating geopolitical tensions and oil price volatility, the future outlook certainly does not look too optimistic. I am unable to tell you which are the exact catalysts that are going to cause the market to break, but in view of the overstretched market valuation, it is not difficult to see why I tend to be less enthusiastic about adding on to my positions in stocks now.
