
 Yahoo Finance
SGX Research: Singapore’s IT Sector Continued to Expand in 1Q18
Information Technology (IT) was the best performing of Singapore’s Sectors in 1Q18. The IT Sector generated a capitalisation weighted 1.0% total return in March, taking its 1Q18 total return to 33%.
Venture is the largest capitalised stock of Singapore’s IT Sector, joined the STI in January, and in late Feb reported net profit growth of 106% in FY17. The stock is scheduled to pay a S$0.60 dividend (+20%) with a 17 May 2018 ex-date.
Singapore’s 10 largest capitalised primary-listed stocks of the IT Sector have generated a median gain of 11% in the year thus far, taking their median 12 month total return to 95%. Half these stocks reported FY17 results during 1Q18, averaging 230% YoY net profit growth.
March also saw the debut of ayondo, a global FinTech group that offers social trading services and brokerage services to both B2C and B2B clients through its two proprietary platforms – WeTrade and TradeHub.
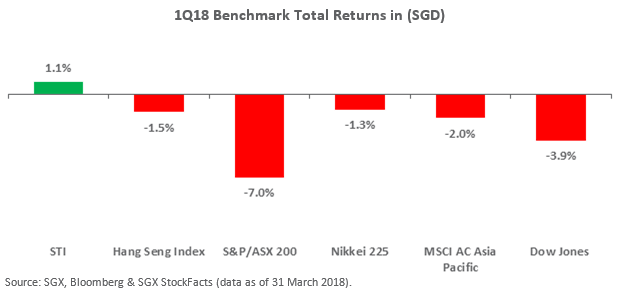
The Straits Times Index (“STI”) generated a dividend inclusive return of 1.1% for the first quarter of 2018.
This compared to the benchmarks of Australia, Hong Kong and Japan averaging a 3.3% decline in SGD terms. Of the major benchmarks, the STI was comparatively resilient in the 2018 year thus far with its performance following the also comparative strong total return of 22.0% in 2017.
Already a highly diversified Index, the STI added the Information Technology (“IT”) Sector into its constituents in early 2018. Venture’s rally from S$22.15 on the open of 5 January to S$28.11 at the end of March positively contributed to the quarterly returns of the STI. The weight of Venture gradually increased from approximately 1.8% on its inclusion, to 2.4% at the end of March. This means that its 27% rally in price contributed approximately 0.5% to 0.6% of the 1.1% STI gains. Venture also makes up approximately two-fifths of the combined market capitalisation of Singapore’s IT Sector.
The IT Sector generated a market capitalisation weighted total return of 1.0% in March, taking its quarterly gain on a market capitalisation weighted basis to 33.0%. This was the strongest of the Sectors moves both in the month of March, in addition to the first quarter of 2018. The IT Sector was also the best performer in 1Q17. During the March 2018 quarter, Singapore’s IT Sector was subject to institutional inflows amounting to +S$14.7 million.
During March the Singapore Institute of Purchasing and Materials Management Electronics Sector PMI recorded an increase of 0.3 points from the previous month to post a faster expansion at 52.4. This reading indicated that the electronics sector has now recorded its 20th month of consecutive expansion.
The next best performing Sectors for 1Q18 were the Materials Sector and Banks. The gains of the Materials Sector were largely attributed to China Sunsine Chemical Hldgs and Delong Holdings which generated similar gains of 53.3% and 52.8%. Together these two stocks make up approximately one-fifth of the combined market capitalisation of the Materials Sector.
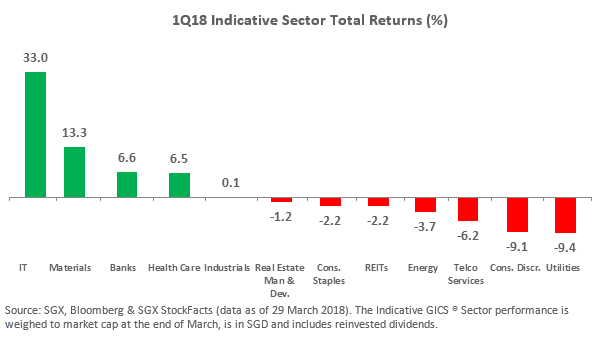
As illustrated above, five of the Sectors have generated gains over the first quarter of 2018 and with the exception of the Health Care Sector, defensive Sectors generated capitalisation weighted declines.
Largest Stocks of the IT Sector
The IT Sector gains of 33.0% followed the Sectors 107% market capitalisation weighted total returns in 2017. Half of the 10 stocks reported their FY17 results in the course of 1Q18 which averaged a net profit growth of 230% YoY.
With the exception of Silverlake Axis, all 10 stocks reported profit growth for the various periods tabled below ending 31 December 2017. Note Silverlake Axis reported that its FY17 NPAT was up 309%. Also note Creative Technology posted a turnaround net profit of US$18.6 million in 1HFY18 compared to a US$12.7 million loss in 1HFY17.
10 Largest Capitalised Primary-Listed Stocks of the IT Sector | SGX Code | Latest Financial Results | Financial Period Reported | Financial Period YoY Net Profit Increase % |
V03 | Full Year ended Dec 2017 | 106 | ||
H17 | Full Year ended Dec 2017 | 123 | ||
5CP | 6M ended Dec 2017 | -84 | ||
558 | Full Year ended Dec 2017 | 129 | ||
BN2 | 9M ended Dec 2017 | 43 | ||
C76 | 6M ended Dec 2017 | Turnaround | ||
AWX | Full Year ended Dec 2017 | 576* | ||
E16 | Full Year ended Dec 2017 | 218 | ||
G20 | 9M ended Dec 2017 | 26 | ||
5DD | 6M ended Dec 2017 | 35 | ||
Average | 130 |
Source: SGX, Bloomberg & SGX StockFacts (data as of 2 April 2018). Note table does not include secondary listing of TPV Technology.*includes loss from discontinued operation in FY16.
The 10 largest capitalised primary-listed stocks of the IT Sector have averaged a 57.5% gain in the year to date, which is a skewed average, due to the performance of Creative Technology. Of the 10 stocks, eight stocks generated gains and the median gain was 10.5%. The gains of the last quarter, brought the median 12 month total return of the 10 stocks to 94.9%. All 10 stocks generated positive gains over the past 12 months.
10 Largest Capitalised Primary-Listed Stocks of the IT Sector | SGX Code | Market Cap S$M | 2 April Closing Price | Total Return YTD % | 12M Total Return % | 3 Years Total Return % |
V03 | 8,003 | 28.110 | 36.2 | 158.7 | 286.8 | |
H17 | 1,665 | 2.300 | 10.2 | 321.4 | 315.3 | |
5CP | 1,355 | 0.535 | -8.6 | 1.7 | -46.9 | |
558 | 606 | 1.170 | 10.8 | 87.4 | 244.5 | |
BN2 | 446 | 1.080 | 14.3 | 69.7 | 189.6 | |
C76 | 422 | 5.610 | 424.3 | 427.9 | 303.6 | |
AWX | 414 | 6.130 | 83.0 | 395.5 | 2,210.5 | |
E16 | 402 | 1.640 | 1.8 | 35.1 | 71.0 | |
G20 | 383 | 0.790 | 6.0 | 29.9 | 34.5 | |
5DD | 281 | 2.020 | -2.6 | 102.3 | 259.9 | |
Average | 57.5 | 162.9 | 386.9 |
Source: SGX, Bloomberg & SGX StockFacts (data as of 2 April 2018). Note table does not include secondary listing of
TPV Technology. *Elec & Eltek Int Co is traded in USD – closing price showed in USD.
ayondo
March also saw the debut of ayondo, a global FinTech group that offers social trading services and brokerage services to both B2C and B2B clients through its two proprietary platforms – WeTrade and TradeHub. WeTrade is for social trading, where traders can view each other’s portfolios, trading performance, track record and risk, as well as share and follow other traders’ trading and investment strategies on a real-time basis. TradeHub is for self-directed trading.
The stock has a market capitalisation of S$94.5 million and is yet to be categorised to a Sector by GICS®, and more details can be found here.
March Indicative Sector Performances
During March, the Straits Times Index (STI) generated a 2.6% decline in total return. As illustrated in the Sector Heatmap below, IT was again the strongest of the sectors in March with a 1.0% market capitalisation total return. This was followed by REITs with a 0.8% total return, and then the Materials Sector with a 2.2% return.
The indicative sum of the best performing sector for each of the past 12 months was 90.7%. As illustrated above, the 90.7% total return, weighed to market capitalisation, started with the IT Sector returning 4.9% in April 2017 and ended with the IT Sector adding 1.0% in March 2018. The IT Sector was the best performing Sector for six of the past 12 months.
The combined decline for the least performing Sector of each of the last 12 months was 46.1%. By comparison, over the 12 months the STI generated a total return of 11.4%. Note this does not include any transactions fees which would be associated with sector rotations. Defensive Sectors were amongst the least performing sectors for 10 of the 12 past months.
