
 Yahoo Finance
SGX Research: DBS, OCBC & UOB Averaged 27% Net Profit Growth in 4Q17
DBS, OCBC & UOB have now all reported FY17 results, with the latter two reporting before the 14 February open. The three banks are amongst the region’s biggest stocks by market capitalisation and account for 38% of the STI’s weight.
The three banks averaged 27% YoY Net Profit Growth for 4Q17, bringing their combined FY17 net profit to $11.9 billion. On average, net interest income contributed 61% to the banks FY17 total income, ranging from 56% for OCBC to 65% for DBS.
The banks share prices have also recently performed comparatively strongly. The three listed bank stocks have averaged a 4.7% YTD price gain, compared to a flat performance by the MSCI World Bank Index.
Singapore’s listed Bank Sector consists of DBS Group Holding (DBS), United Overseas Bank (UOB) and Oversea-Chinese Banking Corporation (OCBC). All three banks have now reported financials for their FY17 and attributed records to earnings growth.
Strong 4Q17 Results as Bank Trio Complete FY17 Reports
All three banks reported net profit growth for FY17 and strong earnings growth in 4Q17:
DBS reported record net profit of $4.390 billion in FY17, up 4% from $4.238 billion in FY16. Its 4Q17 net profit was up 33% YoY to $1.218 billion.
OCBC reported net profit attributable to shareholders was $4.146 billion for FY17, up 19% from $3.473 billion in FY16. This was the first time OCBC reported full year net profit surpassed the $4 billion mark. Its 4Q17 net profit was up 31% YoY to $1.033 billion.
UOB reported record net profit attributable to equity holders was $3.390 billion for FY17 up 9% from $3.096 billion in FY16. Its 4Q17 net profit was up 16% YoY to $855 million.
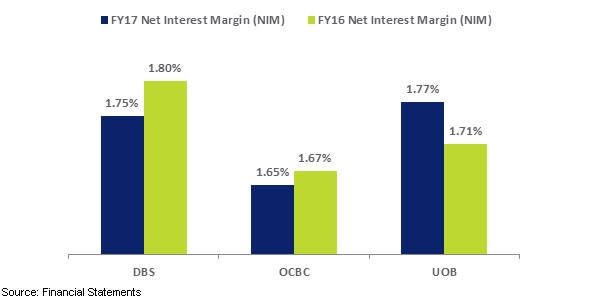
On average, net interest income contributed 61% to the banks’ FY17 total income, ranging from 56% for OCBC to 65% for DBS. FY17 net interest margin (NIM), which represents annualised net interest income as a percentage of total interest bearing assets, averaged 1.72% for the three banks.
Wealth Management Income Surged 38.7% on Average in FY17
All three stocks reported strong growth in wealth management income:
DBS reported FY17 wealth management income growth of 35% YoY to $966 million which led its 12% YoY growth of net fee and commission income.
OCBC’s FY17 wealth management fees and commissions rose 45% YoY to $852 billion which largely drove the 19% YoY increase in overall fee and commission income.
UOB reported wealth management fees grew strongly by 36% YoY to $547 million in FY17, driven by higher sales of treasury products and unit trusts.
Recent Global Outperformance
In the year thus far, Singapore’s three listed bank stocks have averaged a 4.7% price gain, following on from average price gains of 37.3% in 2017. By comparison the MSCI World Bank Index is unchanged in the year-to-date and generated a 10% gain in 2017.

The three banks saw net institutional inflows that totaled $3.3 billion for the 12 months ending January 2018, which was a significant turnaround from net outflows of $154.6 million for calendar year 2016.
Over the past five years the three banks have averaged annualised price gains of 8.3%.
The three banks also currently average a 2.9% dividend yield, with distributions made on a semi-annual basis. For more information on the lager capitalised stocks with dividend yields above 4%, click here.
The three banks currently maintain an average price-to-earnings (P/E) ratio of 14.1x, which is above their five year average P/E of 11.5x. The average price-to-book (P/B) of the three banks is currently 1.41x, which is also higher than the five year average P/B of 1.25x. Meanwhile the average return on equity (RoE) for the banks currently stands at 10%, in-line with the five year average.
For more details on the stocks below, click on the stock name to see the full profile in SGX StockFacts.
Name | SGX Code | Market Cap $M | Last Price* | Price Change 2017 % | Price Change YTD % | Price Change 5 Yr % [Annualised] | Price Change 5 Yr % | Dvd Ind Yld % |
D05 | 70,840 | 27.63 | 43.3 | 11.2 | 12.8 | 83 | 3.3 | |
O39 | 52,616 | 12.57 | 38.9 | 1.5 | 5.3 | 29.3 | 2.9 | |
U11 | 44,636 | 26.84 | 29.7 | 1.5 | 6.7 | 38.4 | 2.6 | |
Average | 37.3 | 4.7 | 8.3 | 50.2 | 2.9 |
Source: SGX StockFacts, Bloomberg (Data as of 13 February 2018)
STI Heavyweights
These three stocks are amongst Singapore’s 10 biggest stocks by market capitalisation, in addition to being amongst South East Asia’s biggest 10 stocks by market capitalisation.
As of yesterday, the three banks maintained a combined market capitalisation of $168.1 billion and accounted for 39.8% of the weight of the Straits Times Index (STI) as of the end of January. This was up from 36.7% at the end of October 2017.
Important Heritages
DBS’ history dates back to 1968 with the incorporation of the Development Bank of Singapore. Thirty years later, the Development Bank of Singapore Ltd purchased POSBank which had and continues to play an important role in the community in promoting national savings. The Development Bank of Singapore was renamed to DBS Bank in 2003 to better reflect the Group’s pan-Asian aspirations. A comprehensive history of the last 20+ years of DBS can be found here.
OCBC was formed through the consolidation of three banks in 1932 – the Chinese Commercial Bank Limited (incorporated in 1912), the Ho Hong Bank Limited (incorporated in 1917) and the Oversea-Chinese Bank Limited (incorporated in 1919). OCBC was the only foreign bank to have branches in China in the 1950s, with a long history in China that dates back to 1925 when it opened its first branch in Xiamen, the first Singapore bank to do so. Click here for more on the history.
United Chinese Bank (UCB) was incorporated in 1935, beginning operations in the Bonham Building. Thirty years later, in 1965, UCB was renamed UOB. Amongst its many important milestones, UOB opened Singapore’s first ATM offering 24-hour banking in 1980, and in 2014 UOB was named the most admired ASEAN Enterprise for ASEAN Centricity by the ASEAN Business Advisory Council. Click here for more on the UOB history.
Global Competitiveness Index Rankings
As part of the Global Competitiveness Index, the World Economic Forum ranks Singapore’s Financial Sector #3 place amongst 137 countries, noting that the financial sector is “well developed, stable and trustworthy”. For availability and affordability of financial services, Singapore ranked #4 and #2 respectively.
The full scorecard can be found here.
This article was originally published on SGX.
