
 Yahoo Finance
 Royal Caribbean (RCL) Stock Up on Q1 Earnings & Revenue Beat

Royal Caribbean Cruises Ltd. RCL reported first-quarter 2023 results, with earnings and revenues beating the Zacks Consensus Estimate. The top and bottom lines increased on a year-over-year basis.
RCL benefited from robust demand, which accelerated well above historical trends and at higher rates. Following the results, the stock has gained 5.3% in the pre-market trading session.
Q1 Earnings & Revenues
Royal Caribbean reported an adjusted loss per share of 23 cents, narrower than the Zacks Consensus Estimate of a loss of 71 cents. In the prior-year quarter, it had incurred an adjusted loss per share of $4.57.
Quarterly revenues of $2,885.1 million outpaced the consensus mark of $2,832 million. In the prior-year quarter, RCL reported revenues of $1,059.2 million. The upside was primarily driven by strong cruising demand, better pricing on close-in demand and strong onboard spending.
Quarterly Highlights
In the first quarter of 2023, passenger ticket revenues amounted to $1,896.5 million, up from $651.9 million in the prior-year quarter. Onboard and other revenues increased to $988.6 million from $407.4 million reported in the year-ago quarter.
Total cruise operating expenses amounted to $1,792.9 million, up 51.3% year over year.
On a constant-currency basis, net yields rose 5.8% compared with the first-quarter 2019 levels. Net cruise costs, excluding fuel per APCD, rose 5.2% on a reported basis and 5.8% on a constant-currency basis. Improvement in net cruise costs was in comparison to the first-quarter 2019 figures.
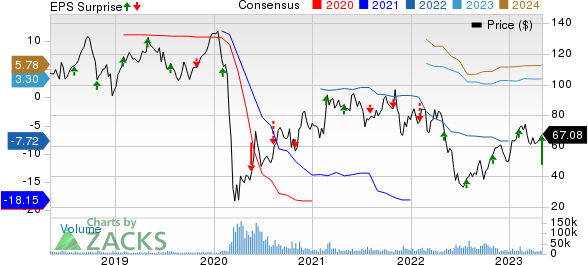
Royal Caribbean Cruises Ltd. Price, Consensus and EPS Surprise
Royal Caribbean Cruises Ltd. price-consensus-eps-surprise-chart | Royal Caribbean Cruises Ltd. Quote
Other Financial Information
As of Mar 31, RCL had cash and cash equivalents of $1,226.9 million compared with $1,935 million as of Dec 31, 2022. As of Mar 31, long-term debt was $19.4 billion compared with $21.3 billion as of Dec 31, 2022.
Booking Update
Royal Caribbean witnesses better-than-expected booking volumes in first-quarter 2023, which were much higher than the 2019 levels. It reported solid bookings with respect to North America consumer. The company also benefited from strong WAVE booking.
Consumer spending onboard and pre-cruise purchases continued to surpass the 2019 levels. Management anticipates load factors to touch historical levels by late spring. In first-quarter 2023, load factors were 102%.
As of Mar 31, RCL had $5.3 billion in customer deposits.
2023 Outlook
In the second quarter of 2023, Royal Caribbean expects depreciation and amortization expenses of $360-$370 million. Net interest expenses (excluding loss on extinguishment of debt) are projected between $305 million and 315 million.
Management estimates adjusted EPS of $1.50-$1.60. The Zacks Consensus Estimate is pegged at $1.00.
For 2023, RCL expects depreciation and amortization expenses between $1,465 million and $1,475 million, down from the prior stated $1,470-$1,490 million. Net interest expenses (excluding loss on extinguishment of debt) are projected at $1,290-1,300 million, down from the earlier mentioned $1,310-1,350 million.
Adjusted EBITDA is expected to surpass the 2019 reported levels. Adjusted EPS is anticipated to be $4.40-$4.80, up from the prior stated $3-$3.60. The Zacks Consensus Estimate for 2023 earnings is pegged at $3.30.
Net yields are anticipated to increase 6.25-7.25% on a reported basis and 6.75%-7.75% in constant currency. The estimated figures are in comparison to the 2019 levels.
Zacks Rank & Key Picks
Royal Caribbean has a Zacks Rank #3 (Hold).
Here we present some better-ranked stocks from the Zacks Consumer Discretionary sector.
Boyd Gaming Corporation BYD currently sports a Zacks Rank #1 (Strong Buy). BYD has a trailing four-quarter earnings surprise of 13.7%, on average. The stock has gained 30.6% in the past six months. You can see the complete list of today’s Zacks #1 Rank stocks here.
The Zacks Consensus Estimate for BYD’s 2023 sales and EPS indicates rises of 1.4% and 2.8%, respectively, from the year-ago period’s reported levels.
Crocs, Inc. CROX carries a Zacks Rank #2 (Buy) at present. CROX has a trailing four-quarter earnings surprise of 19.6%, on average. The stock has surged 71.8% in the past six months.
The Zacks Consensus Estimate for CROX’s 2023 sales and EPS implies improvements of 13.1% and 2.8%, respectively, from the year-ago period’s reported levels.
PlayAGS, Inc. AGS currently carries a Zacks Rank #2. AGS has a trailing four-quarter earnings surprise of 133.3%, on average. The stock has declined 24.7% in the past six months.
The Zacks Consensus Estimate for AGS’ 2024 sales and EPS suggests increases of 3% and 1,873.3%, respectively, from the year-ago period’s reported levels.
Want the latest recommendations from Zacks Investment Research? Today, you can download 7 Best Stocks for the Next 30 Days. Click to get this free report
Royal Caribbean Cruises Ltd. (RCL) : Free Stock Analysis Report
Boyd Gaming Corporation (BYD) : Free Stock Analysis Report
Crocs, Inc. (CROX) : Free Stock Analysis Report
PlayAGS, Inc. (AGS) : Free Stock Analysis Report
