
 Yahoo Finance
 Rising US Yields Push Gold Price towards April Low, $1277 Tipping Point

Talking Points:
- Rebound in US economic data lifts US yields, reduces demand for precious metals.
- One potential catalyst – expectation of looser monetary policy – has failed to materialize.
- Watch for technical response at April low of $1277.
The first quarter of 2014 presented the perfect storm for a rebound in Gold prices: disappointing US economic data amid the beginning of the Federal Reserve’s QE3 program taper; lower US yields boost appeal for hard assets amid concerns of fiat dilution; and rising geopolitical tensions among global economic superpowers in Eastern Europe. Yet over the course of a few short weeks, the price of Gold looks particularly vulnerable as all three of these catalysts have seemingly dissipated.
Weaker US Economic Data
Using the Citi Economic Surprise Index as a proxy for economic data momentum, US fundamental momentum bottomed at a low of -45.9 on April 7, the most depressed reading thus far in 2014. In the weeks since – using the March Nonfarm Payrolls report as the noted turning point – US data has picked up. The index had rebounded to -26.3 as of Monday.
On the jobs side, Initial Jobless and Continuing Claims press their lowest levels in the post-crisis era. The headline unemployment rate has remained at or below 6.7% for the past several months despite the increase in the participation rate – a sign that labor momentum is gaining. Inflation wise, improved consumption trends and elevated food and energy prices look poised to translate into higher consumer prices as 2014 moves forward.
Higher US Yields in Belly Past Week
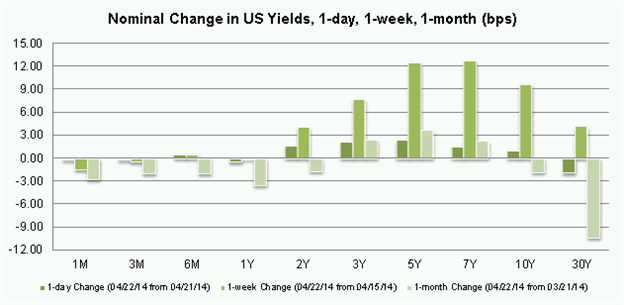
The US interest rate environment has proven more favorable in recent days and weeks, reducing the threat of eroded purchasing power for US Dollar users. While long-term yields (10Y and 30Y) have trended lower over the past month, there’s been a noticeable hump in the US yield curve’s belly the past week, which has previously been a sign of market participants adjusting expectations for a more hawkish Fed. The prospect of a less accommodative Fed going forward chips away at Gold’s appeal as a hedge against fiat dilution from the perspective of a smaller money supply relative to prior expectations.
Gold Price (XAU/USD) Chart (Daily)
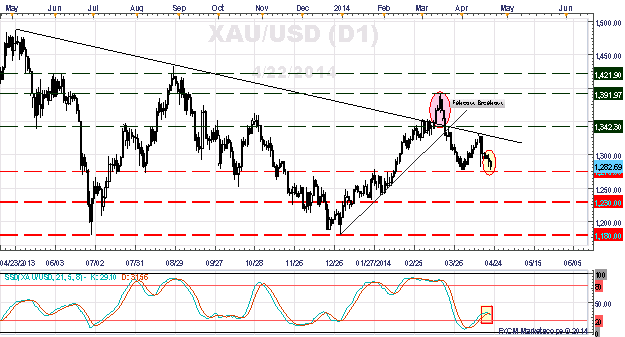
A look at the daily gold price chart of the past year shows that technical weakness may be setting in at a historically important level: $1277. The tumble to this technically significant level – with support or resistance found on numerous occurrences dating back to last June, and most recently, April 1 – comes after a failed breakout move at the end of March.
Gold price had traded through the descending trendline off of the April 2013 and August 2013 highs, only to find failure ahead of $1400 – and the last pivot high seen in the broader downtrend at the end of August 2013 near $1420. The anointment of this descending trendline as a critical market dynamic came on April 14, when it tested the downtrend and failed to breakout again.
Whereas $1277 served as support earlier in April, the imminent retest occurs after extreme oversold momentum has been relieved. In fact, the daily Slow Stochastic indicator will issue a sell signal today on a new closing low for the week. A break below this key April low opens the door for a potentially quick tumble towards $1230/35, where Gold prices found support at the end of January.
What Events Would Drive Gold Price?
GOLD OUTCOME | US Economic Data | ECB Easing | Eastern Europe |
BULLISH | Another below estimate Nonfarm Payrolls | New massive, non-standard easing program a la QE | Armed conflict breaks out in Eastern Ukraine, drawing in EU, Russia, US |
BEARISH | Continued improvement in US economic data, higher US yields | Rebound in Euro-Zone inflation data, further refusal to weaken Euro | Heightened tensions limited to economic sanctions, heated words. |
--- Written by Christopher Vecchio, Currency Analyst
To contact Christopher Vecchio, e-mail cvecchio@dailyfx.com
Follow him on Twitter at @CVecchioFX
To be added to Christopher’s e-mail distribution list, please fill out this form
DailyFX provides forex news and technical analysis on the trends that influence the global currency markets.
Learn forex trading with a free practice account and trading charts from FXCM.
