
 Yahoo Finance
 Regions Financial (RF) Q3 Earnings Beat Estimates, Costs Up
Regions Financial RF reported third-quarter 2021 earnings of 66 cents per share, which surpassed the Zacks Consensus Estimate of 53 cents. Also, the bottom line compares favorably with the prior-year quarter’s 49 cents. These figures are adjusted for non-recurring items.
Results were driven by a strong capital position. Moreover, rise in deposit balances provided some respite. Notably, benefit from credit losses was a tailwind. However, lower revenues and rising expenses were major drags.
Including certain one-time items, net income available to common shareholders was $624 million or 65 cents per share compared with the $501 million or 52 cents reported in the year-ago period.
Revenues Decrease, Expenses Rise
Total revenues came in at $1.61 billion in the reported quarter, outpacing the Zacks Consensus Estimate of $1.56 billion. However, the top line edged down 1.8% from the year-ago quarter’s reported number.
On a fully-taxable equivalent (FTE) basis, net interest income was $976 million, down 2.4% year over year. Also, net interest margin shrunk 11 basis points (bps) to 3.3%.
Non-interest income decreased marginally year over year to $649 million. This downside mainly resulted from lower mortgage income, net securities gains and market value adjustments on employee benefit assets.
Non-interest expense flared up 4.7% year over year to $938 million, mainly due to rise in salaries and employee benefits, marketing, equipment and software expense, FDIC insurance assessments, credit/checkcard expenses, loss on early extinguishment of debt and other expenses. On an adjusted basis, non-interest expenses rose 3.3% year over year to $918 million.
Adjusted efficiency ratio came in at 56.6% compared with the prior-year quarter’s 55.3%. A higher ratio indicates a fall in profitability.
Balance Sheet Position
As of Sep 30, 2021, loans, net of unearned income, declined slightly on a sequential basis to $83.3 billion. Similarly, total deposits came in at $132 billion, marginally up from the prior quarter.
As of Sep 30, 2021, low-cost deposits, as a percentage of end of period deposits, were 96.7% compared with the prior-year quarter’s 95%. In addition, deposit costs came in at 4 bps during the July-September period.
Improved Credit Quality
Credit metrics were robust during the third quarter. Non-performing assets, as a percentage of loans, foreclosed properties and non-performing loans held for sale, shrunk 24 bps from the prior-year quarter to 0.9%. Additionally, non-accrual loans, excluding loans held for sale, as a percentage of loans, came in at 0.64%, contracting 23 bps.
Allowance for credit losses as a percentage of loans, net of unearned income was 1.8%, down 94 bps from the year-earlier quarter. The company’s total business services criticized loans fell 18%.
Moreover, annualized net charge-offs, as a percentage of average loans, came in at 0.14%, contracting 36 bps. Benefit from credit losses of $155 million was recorded during the quarter against the year-earlier quarter provision of $113 million.
Solid Capital Position
Regions Financial’s estimated ratios remained well above the regulatory requirements under the Basel III capital rules. As of Sep 30, 2021, Basel III Common Equity Tier 1 ratio (fully phased-in) and Tier 1 capital ratio were estimated at 10.8% and 12.3%, respectively, compared with the 9.3% and 10.8% recorded in the year-earlier quarter.
Our Viewpoint
Regions Financial put up a decent performance during the reported quarter on sound capital position, as well as improved credit quality metrics. The company’s focus on inorganic growth routes and diverse product offerings, along with investments in talent and technology to support growth, will likely yield stellar earnings in the upcoming period as well.
Though lower revenues and rising costs are concerning, we are optimistic about the bank’s branch-consolidation plan. Nevertheless, margin pressure is expected to prevail.
Regions Financial Corporation Price, Consensus and EPS Surprise
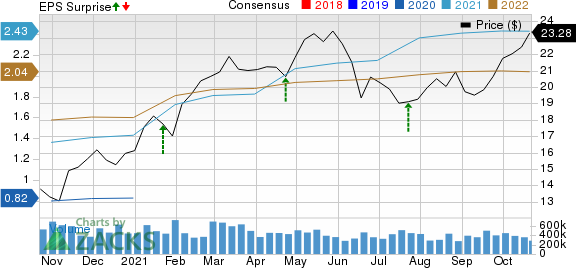
Regions Financial Corporation price-consensus-eps-surprise-chart | Regions Financial Corporation Quote
Currently, Regions carries a Zacks Rank #3 (Hold). You can see the complete list of today’s Zacks #1 Rank (Strong Buy) stocks here.
Performance of Other Banks
Bank of America’s BAC third-quarter 2021 earnings of $1.03 per share handily beat the Zacks Consensus Estimate of 77 cents. The bottom line compared favorably with the 37 cents earned in the prior-year quarter.
PNC Financial PNC pulled off a third-quarter earnings surprise of 42.4% on substantial reserve release. The adjusted earnings per share of $4.50 exceeded the Zacks Consensus Estimate of $3.16.
Large reserve releases, solid investment banking performance and modest rise in loan demand drove JPMorgan’s JPM third-quarter 2021 earnings of $3.78 per share. The bottom line comfortably outpaced the Zacks Consensus Estimate of $3.05.
Want the latest recommendations from Zacks Investment Research? Today, you can download 7 Best Stocks for the Next 30 Days. Click to get this free report
Bank of America Corporation (BAC) : Free Stock Analysis Report
JPMorgan Chase & Co. (JPM) : Free Stock Analysis Report
Regions Financial Corporation (RF) : Free Stock Analysis Report
The PNC Financial Services Group, Inc (PNC) : Free Stock Analysis Report
To read this article on Zacks.com click here.
