
 Yahoo Finance
 Property Myths Debunked: From OCR gains to thinner HDB walls and shrinking floor areas
Most of us have our own personal preconceptions about property ownership. For example, some of us believe high-floor units have better value if the view’s unblocked. Others may feel that units with #4 signify bad luck and usually sell at lower prices.
While a lot of these preconceptions are more about common sense and understanding market research than myths, there are some which continue to stick time and time again.
As part of a series to debunk some “property myths”, here’re the first 5 we’ve compiled that may surprise even the experienced property observer among us.
Property Myth #1: “If you buy a condo in the OCR, your gain will never be as high as buying one that’s in the CCR or RCR.”
Contrary to popular belief, market trends show that the average psf price of OCR condos has risen 97.05% since 2007 (over 15 years). This is much higher compared to condos in the RCR (80.47%) and CCR (27.45%).
If you’d deliberated between buying a condo in the OCR, RCR or CCR, say in 2007, and picked one in the OCR, you would have gained much more in psf price terms – as long as you’re still holding onto that condo today.

However, if you look at average psf price appreciation over the past 5 or 10 years, the story’s a little different.
Over the past 10 years, condos in the RCR performed markedly better (at 30.71%) than the ones in OCR (18.94%) and CCR (26.96%).
What this means, is that if you’ve bought a condo in the RCR 10 years ago, you would probably have gained more (in average psf terms) than if you’d bought a unit in the CCR or OCR.

If you’re specifically looking at prices 5 years ago, the average psf prices of condos in the RCR continue to perform better on average (19.90%), compared to OCR (15.35%) and CCR (13.71%).
So is the myth debunked? Yes, if we reference average psf price appreciation over the past 15 years.
Notably, OCR condo psf prices may see several milestones in a few years. This is thanks to major developments in OCR neighbourhoods like Tampines North, Paya Lebar Airbase, Punggol Digital District and Jurong Lake District.
Property Myth #2: “Newer HDB flats have thinner walls compared to older flats.”
It began with the sound of marbles rolling or dropping inside our HDB flat ceilings. In 2018, it became a Parliamentary question.
Member of Parliament Dennis Tan asked the Minister for National Development whether the level of sound-proofing in our HDB BTO flats has declined with the use of non-concrete walls and with the more recent flat or building designs.
CNA even did a commentary video on this:
Anyway, in response to MP Tan, MND shared that HDB buildings are constructed using reinforced concrete in accordance with prevailing building codes and industry norms.
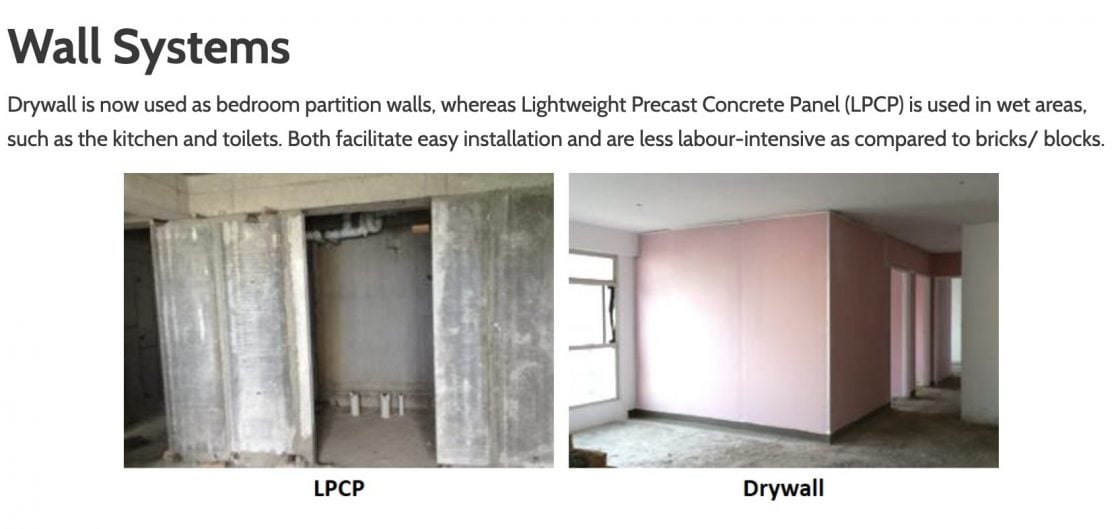
Since November 2014, all residential non-landed developments use non-concrete drywalls for internal partitions, except for wet areas such as bathrooms and kitchens.
The drywall systems used in BTO developments comprise a metal framework with gypsum plaster panels on both sides and are filled with sound insulation material.
So even if these non-concrete drywalls appear thinner due to the density of new flats, sound-proofing-wise, they’ve been proven to work the same as concrete walls in older flats.
One possible reason why it’s become mandatory for a percentage of our non-landed residential spaces to use the drywall system is productivity and sustainability. This reduces the use (and potentially higher cost) of cement and sand.
Property Myth #3: “Older HDB flats are bigger than current BTO flats.”
We’ve talked about this before. Generally, most older, resale flats are bigger (but also require higher capital outlay) compared to BTO flats. With increasing land constraints and population dynamics over the years, it’s natural to assume that flat sizes would shrink, right?
In fact, this subject was raised in Parliament in April 2022, when MP Louis Chua asked if the government would consider increasing the average size of HDB flats across flat types in view of changing societal trends and work norms.
The government’s response? “HDB flats are designed to provide a living environment that is functional and comfortable. For instance, bedrooms are built with large windows to optimise natural lighting and ventilation, while kitchens are designed to be open to increase the sense of spaciousness. HDB flat sizes have not changed since 1997, but average household sizes have decreased.”
So, has the average household size decreased?
Period | Flat type | (a) Floor area | (b) Average | Living space |
1980s | 3-room | 69 sq m | 4.6 | 15 sq m |
4-room | 105 sq m | 23 sq m | ||
5-room | 123 sq m | 27 sq m | ||
Executive | 145 sq m | 32 sq m | ||
1990s | 3-room | n/a | 3.9 | n/a |
4-room | 100 sq m | 26 sq m | ||
5-room | 120 sq m | 31 sq m | ||
Executive | 140 sq m | 36 sq m | ||
2000s | 3-room | 65 sq m | 3.4 | 19 sq m |
4-room | 90 sq m | 26 sq m | ||
5-room | 110 sq m | 32 sq m | ||
Executive | n/a | n/a |
Data source: HDB (2015)
When the first point blocks were constructed in 1970, these four and five-room flats in 20-storey blocks were between 84 and 125 square metres. In the 1980s, four rooms were roughly 105 square metres and five rooms had a floor area of about 123 square metres. With average household sizes around 4.6 per apartment at the time, the living space per person was around 23-27 square metres (4 or 5 rooms).
By the 1990s, due to a lower average household size of 3.9 and four-room flat sizes shrinking to around 100 square metres and five-room flats to around 120 square metres, the living space per person actually increased to 26-31 square metres (4 or 5 rooms).
It was also the same period when HDB introduced premium apartments and executive condominiums to give residents more options if they want more space and amenities.
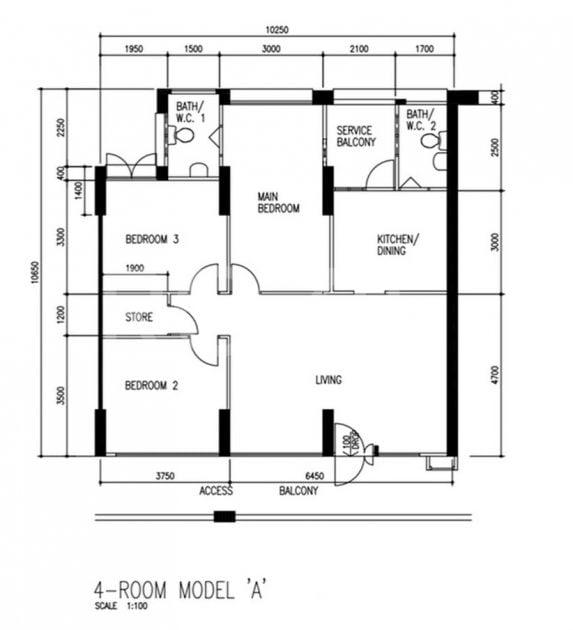
By the year 2000 through 2010s, apartment sizes were further downsized, losing about 10 square metres each. For example, in the 2000s, a four-room flat was 90 square metres while a five-room was 110 square metres. The average household size was 3.4, which meant that on average, the living space of a person is 26-32 square metres (for 4-5 room flats).
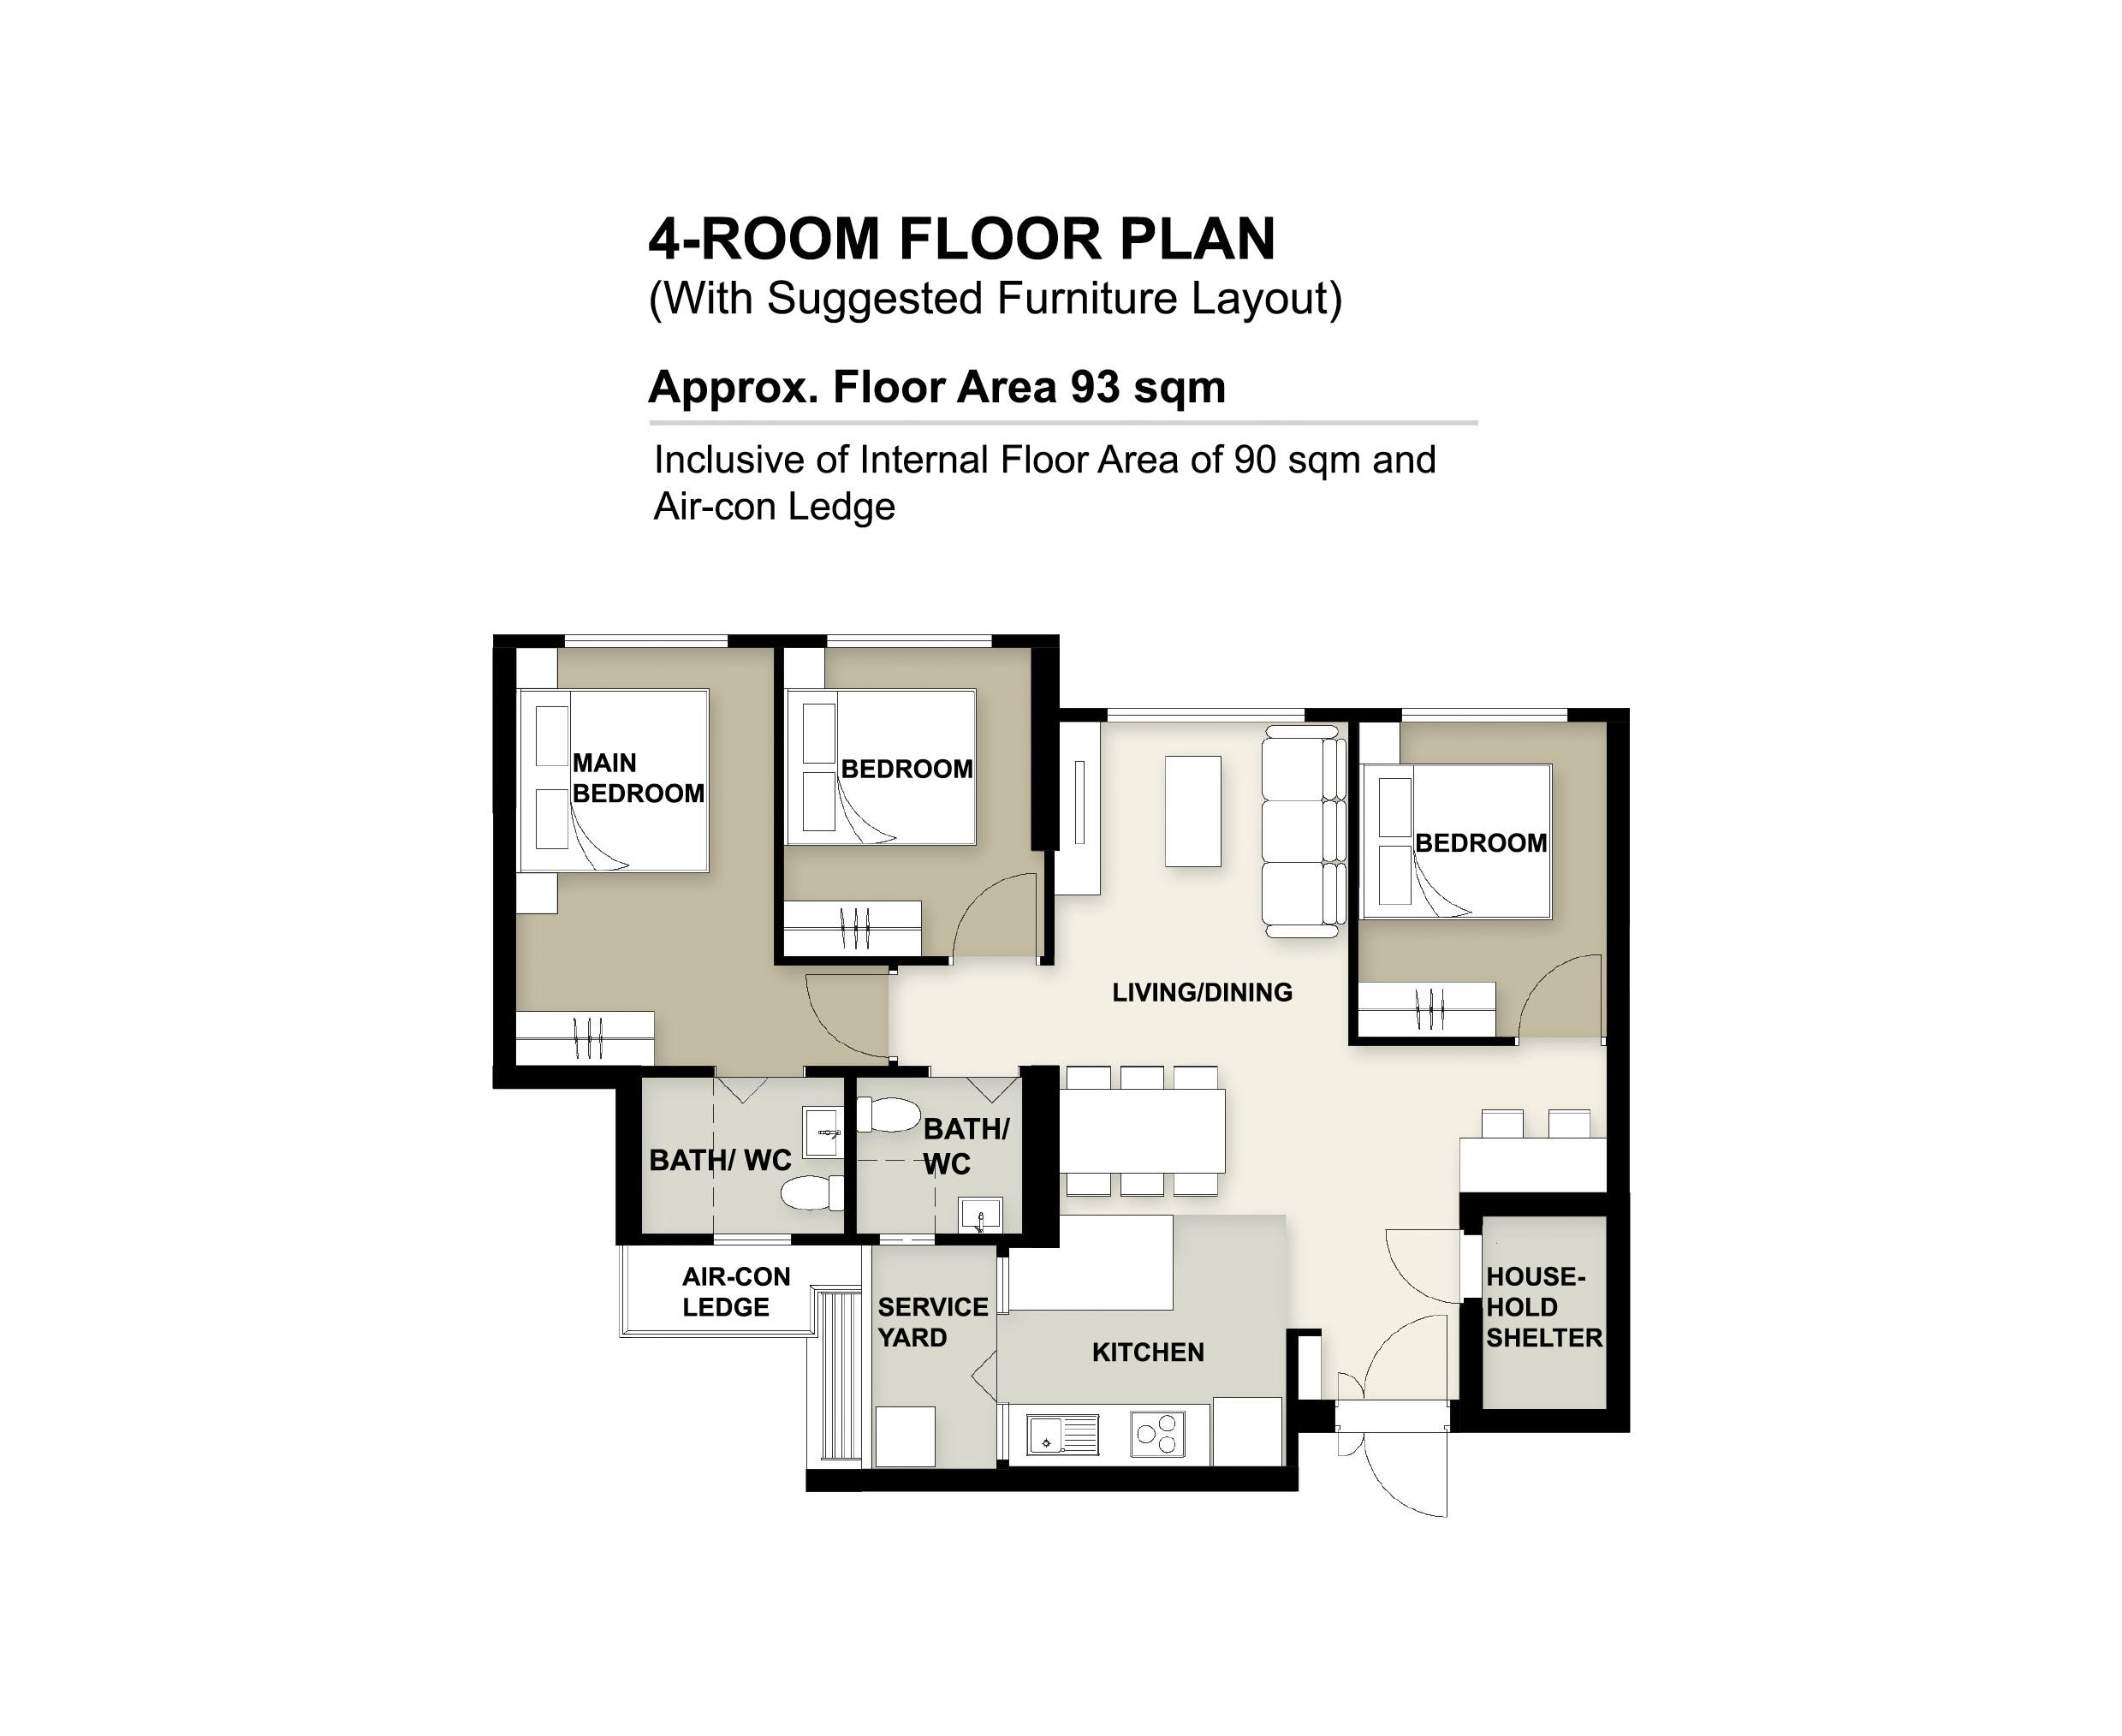
Today, a typical four-room BTO flat is around 93 sqm, while a five-room is around 113 sqm.

So, is this property myth debunked? Depends on how “old” the HDB resale flat is and whether you define “space” as the entire floor area or living space per household member.
If you’re buying a freshly MOPed HDB flat from the resale market, chances are there wouldn’t be that much size difference with a BTO flat.
If you’re specifically looking for HDB flat types which are older or no longer constructed (eg. executive maisonettes and jumbo flats), then yes, they definitely offer more space but at reduced leases.
Property Myth #4: “Owning a freehold means you can own it for life and pass it down to future generations.”
The general idea of buying freehold is that you want to own the property indefinitely (and pass it on to your children when you pass on). This is as opposed to a 99-year leasehold property which reverts back to the state upon lease expiry.
Unfortunately, even if you own a freehold property, the government is allowed to reclaim the land for vital infrastructure or security reasons.
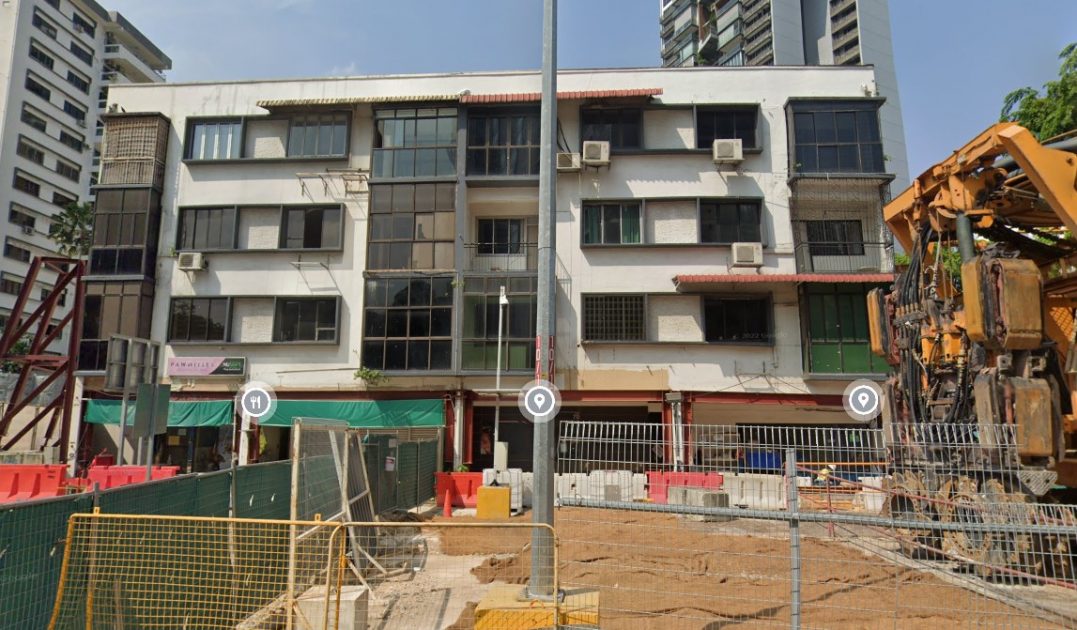
This has happened to owners of the four-storey Thomson Road freehold property (to make way for the North-South Corridor) and freehold terrace house owners along Merpati Road and Jalan Anggerek.
This is possible because the government passed the Land Acquisition Act in 1966. This law enables the government to expedite the land acquisition process to make land available for housing, commercial and industrial purposes.
This can also happen if a developer wants to acquire a freehold development and at least 80 per cent of residents agree to it (for properties older than 10 years).
Even if you disagree with it, you’ll have to pack up and move. There have been a few freehold properties which went for a collective sale (or attempted to) – High Point and The Beaumont to name a few.
So is this myth debunked? Definitely – if you’re one of few freehold property owners who is forced to move.
Property Myth #5: “Older HDB flats with 60-70+ years left on the lease are not worth buying.”
The phrase “not worth buying” is subjective. If ‘worth’ here means monetary gain, that’s also subjective.
Look at it this way – if beauty is in the eye of the beholder, then the true value of a home is best known only in the heart of the home-buyer.
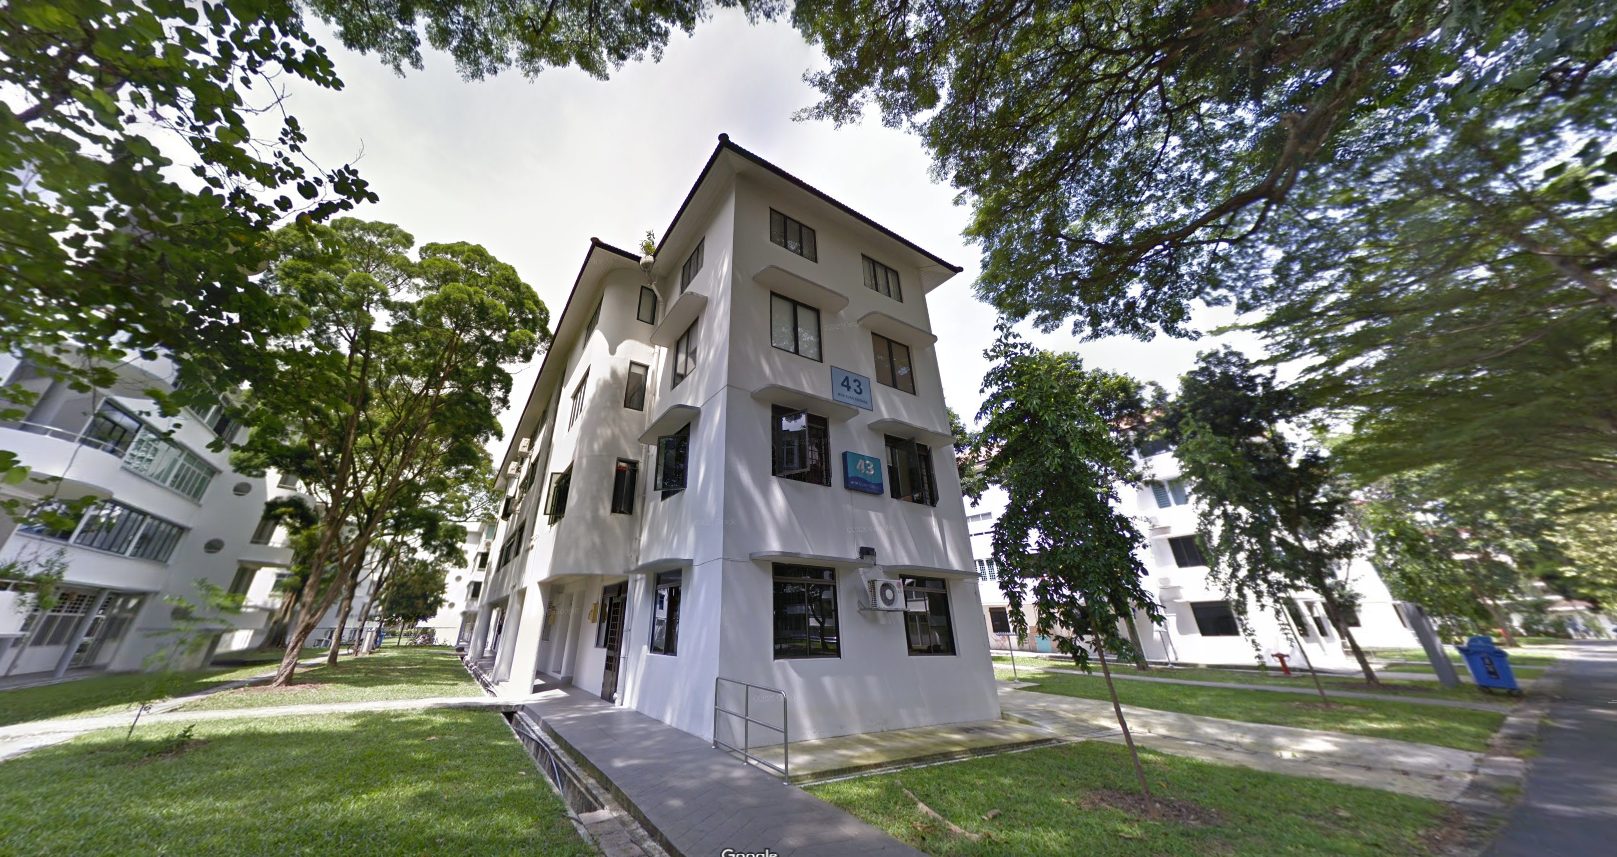
Take the example of this 43-year-old Tiong Bahru walk-up apartment at Moh Guan Terrace. It was sold for S$1.088m in 2020 and it doesn’t even come with a lift.
In fact, we’ve previously reported that there were more flats aged 40 years or above sold in Q2 2019 compared to the same period in 2018.
If we look at HDB resale value over the past 10 years and compare the periods they were completed, we get some interesting findings:
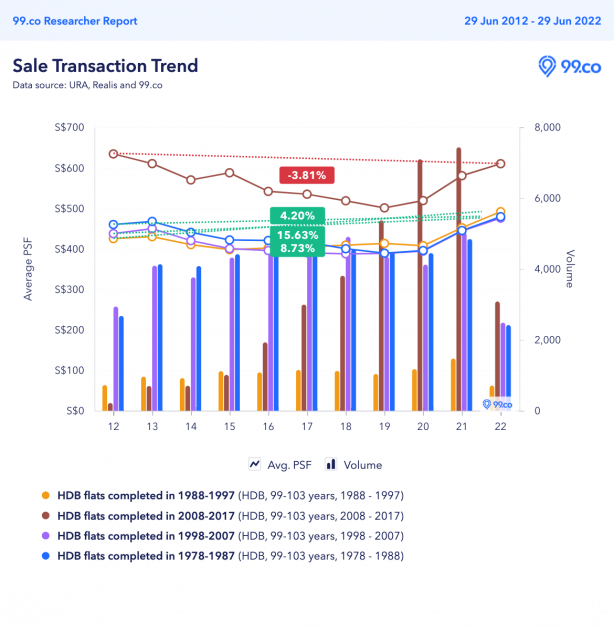
While it is still too early to tell with the most recent decade (HDB resale flats completed in 2008-2017), it seems flats completed in 1988-1997 (25 to 34 years old) have a higher average psf price increase (15.63%) over the past 10 years compared to resale flats completed in 1978-1987 (4.20%) and 1998-2007 (8.73%).
So it seems flats with 65 to 74 years left on their leases, despite seeing much lesser demand, are still commanding the “worth” in terms of average psf price appreciation.
This means the myth that flats with 60-70 years left on their leases are worth much less is not entirely true.
–
Disagree with some of these debunked myths? Let us know your perspectives in the comments below!
If you enjoyed this article, 99.co recommends 5 property myths Singaporeans wholeheartedly believe in and Truths and Myths about Compact Units in Singapore.
The post Property Myths Debunked: From OCR gains to thinner HDB walls and shrinking floor areas appeared first on .
