
 Yahoo Finance
 Price & Time: Watching the Commodity Bloc
This publication attempts to further explore the concept that mass movements of human psychology, as represented by the financial markets, are subject to the mathematical laws of nature and through the use of various geometric, arithmetic, statistical and cyclical techniques a better understanding of markets and their corresponding movements can be obtained.
Foreign Exchange Price & Time at a Glance:
EUR/USD:

Charts Created using Marketscope – Prepared by Kristian Kerr
-EUR/USD broke under the 1x2 Gann line from the 2011 high last week and is now in consolidation just under this level (now 1.3365)
- This keeps focus lower with weakness below a minor Fibonacci confluence in the 1.3290 area needed to setup the next downside extension
- In addition to the aforementioned Gann line, resistance is seen near a pitchfork line connecting the February highs at 1.3390
- A break over this level needed to undermine immediate negative outlook, but only strength over the further resistance at 1.3460 shifts attention higher
- Near term cyclical studies indicate Tuesday is a minor turn window where a counter-trend move lasting a few days could materialize
Strategy: We still like holding short positions here, but with the cyclical picture turning more positive over the next few days prudence dictates that stops to be tightened.
USD/CHF:
Charts Created using Marketscope – Prepared by Kristian Kerr
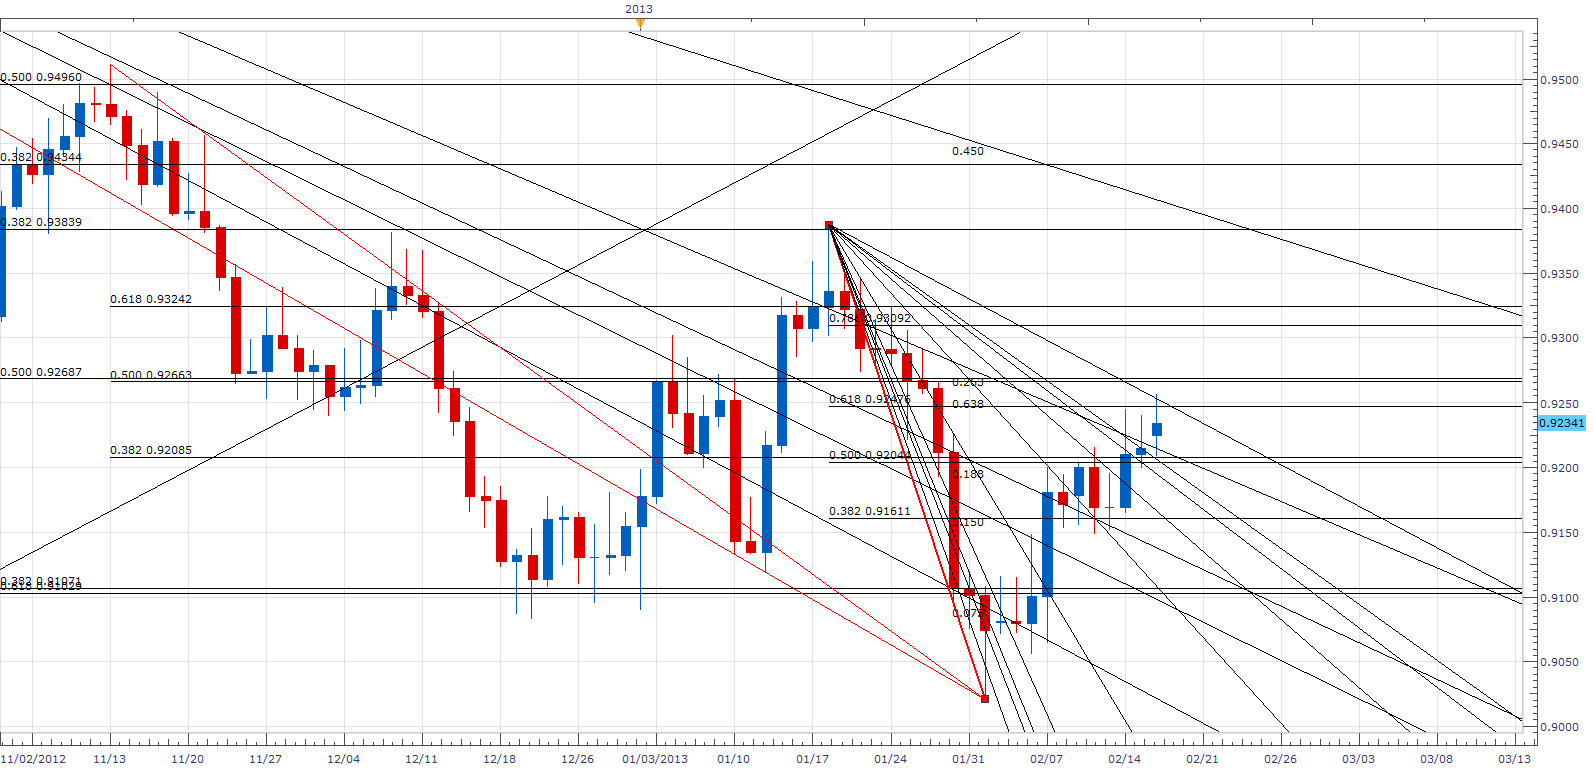
- USD/CHF has moved steadily higher since finding demand at the start of the month just under the 61.8% retracement of the October 2011 to July 2012 advacne
- Focus is to the upside with the 50% retracement of the same move in the .9270 area now immediate resistance
- A clear push over this level is need to trigger a more important push higher towards various Fibonacci and Gann levels over the .9300 handle
- The 50% retracement of the year-to-date range near .9200 is now immediate support with weakness under this level required to undermine the immediate positive picture
- Shorter cycles warn that a reversal could be attempted over the next couple of days
Strategy: We like holding longs while over .9200, but with the near-term cyclical picture getting a little more negative over the next few days we are getting wary of a potential reversal. Tighten stops.
EUR/CHF:

Charts Created using Marketscope – Prepared by Kristian Kerr
- EUR/CHF has settled into a consolidation between the 50% retracement of the September to January advance and the 38% retracement of the January to February decline
- As such, these levels are now key for the cross with strength over 1.2375 needed to turn the outlook more positive
- Likewise, weakness under 1.2275 now needed to signal that a deeper retracement is underway
- Cyclical picture is also quite muddled, but near-term studies seem to favor the upside over the next few days
Strategy: Cross is a bit of a mess here. We still like getting long on any strength over the recent range. We are less excited about chasing a break to the downside.
Focus Chart of the Day: NZD/USD
Charts Created using Marketscope – Prepared by Kristian Kerr
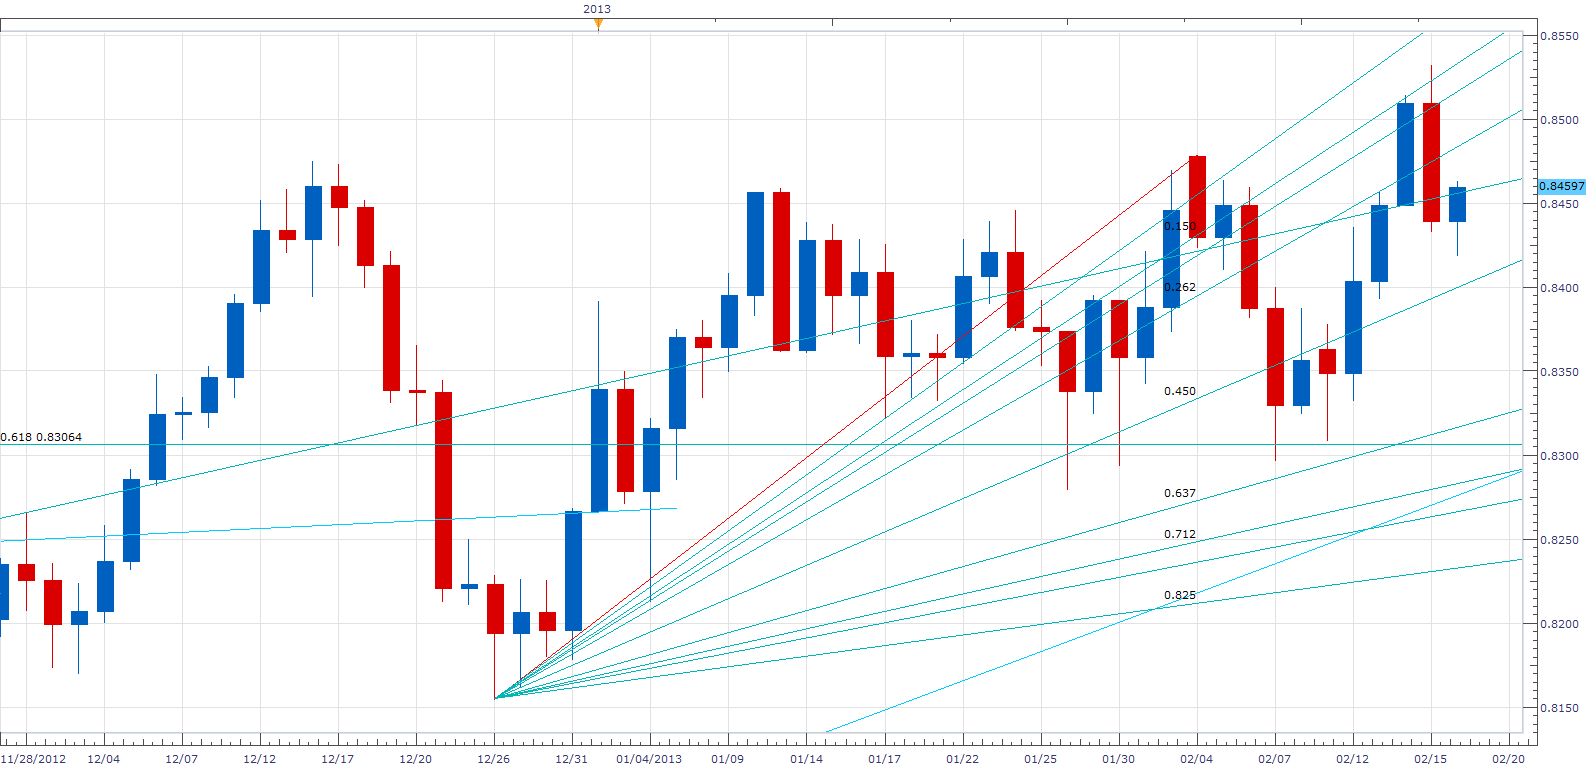
This is an important week for the commodity bloc from a timing perspective. A Pi frequency related to last year’s June low in these currencies suggests strong potential for a turn of some significance this week. On this note it is worth noting that NZD/USD recorded its highest level since September of 2011 on Friday. Such action would normally be quite bullish from a technical perspective, but given the possible cycle at play we can’t help but wonder if a peak of some sort is going to be seen. The price action over the next few days should be key. We will be closely watching the second square root progression from Friday’s high near .8350 as a close under this level would be a good sign that a turn is indeed being witnessed in the Bird.
--- Written by Kristian Kerr, Senior Currency Strategist for DailyFX.com
To receive other reports from this author via e-mail, sign up to Kristian’s e-mail distribution list via this link.
New to forex? Sign up for our DailyFX Forex Education Series
DailyFX provides forex news and technical analysis on the trends that influence the global currency markets.
Learn forex trading with a free practice account and trading charts from FXCM.
