Price & Time: Cycles Pointing to a Potential Reversal
This publication attempts to further explore the concept that mass movements of human psychology, as represented by the financial markets, are subject to the mathematical laws of nature and through the use of various geometric, arithmetic, statistical and cyclical techniques a better understanding of markets and their corresponding movements can be achieved.
Foreign Exchange Price & Time at a Glance:
USD/JPY:
Charts Created using Marketscope – Prepared by Kristian Kerr
- It was a wild start to the week on Monday with USD/JPY gapping through the 38% retracement of the 2007 to 2011 decline to print its highest level in almost 3 years
- This upside break proved false, however, as the pair reversed these gains and broke below several key Gann levels including the 92.85 second square root progression from Monday’s high and the 92.00 square of nine support related to the 2011 low
- This action has shifted our bias lower with focus now on the fourth square root progression from Monday’s high at 90.90, a break of which is needed to prompt the next leg lower
- Shorter-term focused cyclical techniques are unclear
- Gann and Fibonacci resistance between 92.85 and 93.20 should cap on the upside and only strength over these levels signals a broader trend resumption
Strategy: Move through 92.00 got us short. We like that position while under 93.20.
AUD/USD:
Charts Created using Marketscope – Prepared by Kristian Kerr
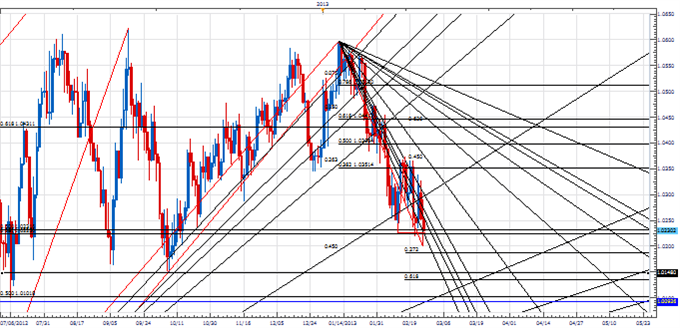
- Repeated upside failures in AUD/USD at the 38% retracement of the year-to-date range have led to further weakness in the pair
- On Tuesday the 38% retracement of the late 2012 advance at 1.0230 was breached keeping immediate focus lower (though a close below would be more negative)
-Minor extension support at 1.0185 and 1.0135 are the next barriers ahead of a key Gann/Fib cluster just under 1.0100
- Near-term cycle techniques urge some caution here, however, as there is scope for a low to be attempted over the next few days
- The 38% retracement of the year-to-date range now at 1.0350 remains key resistance and only over this level undermines the immediate negative tone in the pair
Strategy: We like the short side while under 1.0350, but with the cyclical tide potentially turning positive over the next few days prudence dictates that stops should be tightened.
EUR/SEK:
Charts Created using Marketscope – Prepared by Kristian Kerr
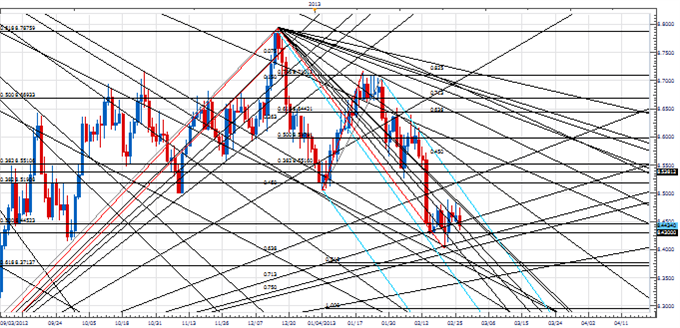
- EUR/SEK is in consolidation mode since finding support near the 100% projection of the December to January decline near 8.4300 last week
- Immediate resistance seen at the 2x1 Gann fan line from the December high near 8.4800, but while under the 38% retracement of the 2012 range near 8.5200 our bias is to the downside
- Close under the 8.4300 measured move level now needed to prompt renewed weakness towards the next Fibonacci cluster just above 8.3700
- Cyclical picture is not the clearest, but marginal positive bias seen over next few days
- Only strength over 8.5200 shifts attention higher in the cross
Strategy: We like selling the cross on a break of 8.4300. Wouldn’t risk too much above 8.4800, however.
Focus Chart of the Day: S&P 500
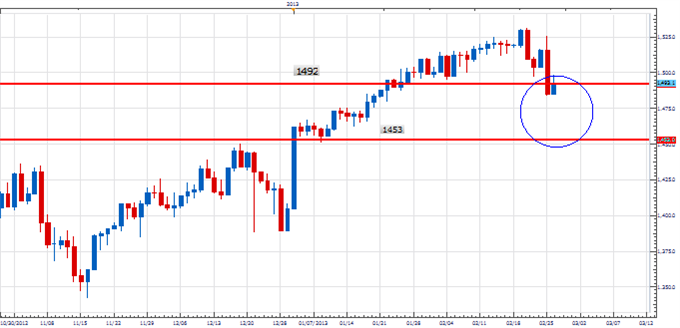
Over the past few weeks we have highlighted several cyclical views of the S&P 500 that suggest a top of some importance has been seen. The first square root progression from last week’s high at 1492 was our first target and this was reached yesterday. We have now reached a moment of truth of sorts as the price action around this level all the way down to the next square root progression at 1453 will be very telling about the general state of the equity markets. If the cyclical response over the past few days was/is just a correction in a broader uptrend then this is where it should try to resume from. On the dark side, if the 1453 second square root progression is quickly breached it will be strong evidence that a top of importance has been seen and the decline that follows should be severe.
--- Written by Kristian Kerr, Senior Currency Strategist for DailyFX.com
To contact Kristian, e-mail kkerr@fxcm.com. Follow me on Twitter at@KKerrFX.
Are you looking for other ways to pinpoint support and resistance levels? Take our free tutorial on using Fibonacci retracements.
To receive other reports from this author via e-mail, sign up to Kristian’s e-mail distribution list via this link.
DailyFX provides forex news and technical analysis on the trends that influence the global currency markets.
Learn forex trading with a free practice account and trading charts from FXCM.

 Yahoo Finance


