
 Yahoo Finance
 Will Pfleiderer Group Spólka Akcyjna (WSE:PFL) Continue To Underperform Its Industry?

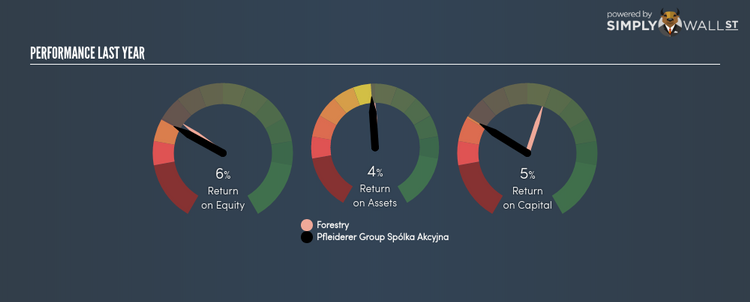
Pfleiderer Group Spólka Akcyjna’s (WSE:PFL) most recent return on equity was a substandard 6.19% relative to its industry performance of 7.39% over the past year. An investor may attribute an inferior ROE to a relatively inefficient performance, and whilst this can often be the case, knowing the nuts and bolts of the ROE calculation may change that perspective and give you a deeper insight into PFL’s past performance. Today I will look at how components such as financial leverage can influence ROE which may impact the sustainability of PFL’s returns. Check out our latest analysis for Pfleiderer Group Spólka Akcyjna
What you must know about ROE
Return on Equity (ROE) is a measure of Pfleiderer Group Spólka Akcyjna’s profit relative to its shareholders’ equity. For example, if the company invests PLN1 in the form of equity, it will generate PLN0.06 in earnings from this. In most cases, a higher ROE is preferred; however, there are many other factors we must consider prior to making any investment decisions.
Return on Equity = Net Profit ÷ Shareholders Equity
ROE is measured against cost of equity in order to determine the efficiency of Pfleiderer Group Spólka Akcyjna’s equity capital deployed. Its cost of equity is 10.08%. This means Pfleiderer Group Spólka Akcyjna’s returns actually do not cover its own cost of equity, with a discrepancy of -3.89%. This isn’t sustainable as it implies, very simply, that the company pays more for its capital than what it generates in return. ROE can be broken down into three different ratios: net profit margin, asset turnover, and financial leverage. This is called the Dupont Formula:
Dupont Formula
ROE = profit margin × asset turnover × financial leverage
ROE = (annual net profit ÷ sales) × (sales ÷ assets) × (assets ÷ shareholders’ equity)
ROE = annual net profit ÷ shareholders’ equity
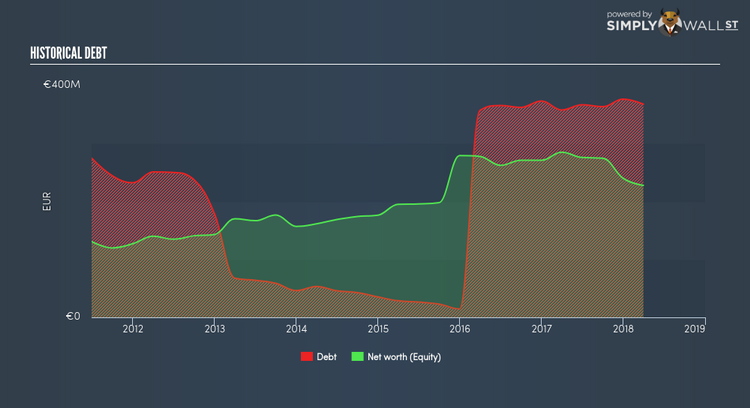
The first component is profit margin, which measures how much of sales is retained after the company pays for all its expenses. The other component, asset turnover, illustrates how much revenue Pfleiderer Group Spólka Akcyjna can make from its asset base. The most interesting ratio, and reflective of sustainability of its ROE, is financial leverage. Since ROE can be artificially increased through excessive borrowing, we should check Pfleiderer Group Spólka Akcyjna’s historic debt-to-equity ratio. At 161.43%, Pfleiderer Group Spólka Akcyjna’s debt-to-equity ratio appears relatively high and indicates the below-average ROE is already being generated by significant leverage levels.
Next Steps:
ROE is a simple yet informative ratio, illustrating the various components that each measure the quality of the overall stock. Pfleiderer Group Spólka Akcyjna exhibits a weak ROE against its peers, as well as insufficient levels to cover its own cost of equity this year. Although, its appropriate level of leverage means investors can be more confident in the sustainability of Pfleiderer Group Spólka Akcyjna’s return with a possible increase should the company decide to increase its debt levels. Although ROE can be a useful metric, it is only a small part of diligent research.
For Pfleiderer Group Spólka Akcyjna, I’ve put together three pertinent aspects you should further research:
Financial Health: Does it have a healthy balance sheet? Take a look at our free balance sheet analysis with six simple checks on key factors like leverage and risk.
Valuation: What is Pfleiderer Group Spólka Akcyjna worth today? Is the stock undervalued, even when its growth outlook is factored into its intrinsic value? The intrinsic value infographic in our free research report helps visualize whether Pfleiderer Group Spólka Akcyjna is currently mispriced by the market.
Other High-Growth Alternatives : Are there other high-growth stocks you could be holding instead of Pfleiderer Group Spólka Akcyjna? Explore our interactive list of stocks with large growth potential to get an idea of what else is out there you may be missing!
To help readers see pass the short term volatility of the financial market, we aim to bring you a long-term focused research analysis purely driven by fundamental data. Note that our analysis does not factor in the latest price sensitive company announcements.
The author is an independent contributor and at the time of publication had no position in the stocks mentioned.
