
 Yahoo Finance
 S&P 500 & Nasdaq 100: Trading Levels for Short-term Operators
DailyFX.com -
What’s inside:
Short-term trading levels and lines
The S&P 500 having a lot of difficulty overcoming resistance in the 2130s
The Nasdaq 100 remains postured poorly, with its own levels to overcome to turn it around
The market is still in ‘chop’ mode, so we will continue to look to short-term levels and be quick to peel off trades at the first sign of opposition. The following are based on cash session levels, operating between the hours of 13:30 to 20:00 GMT time.
S&P 500
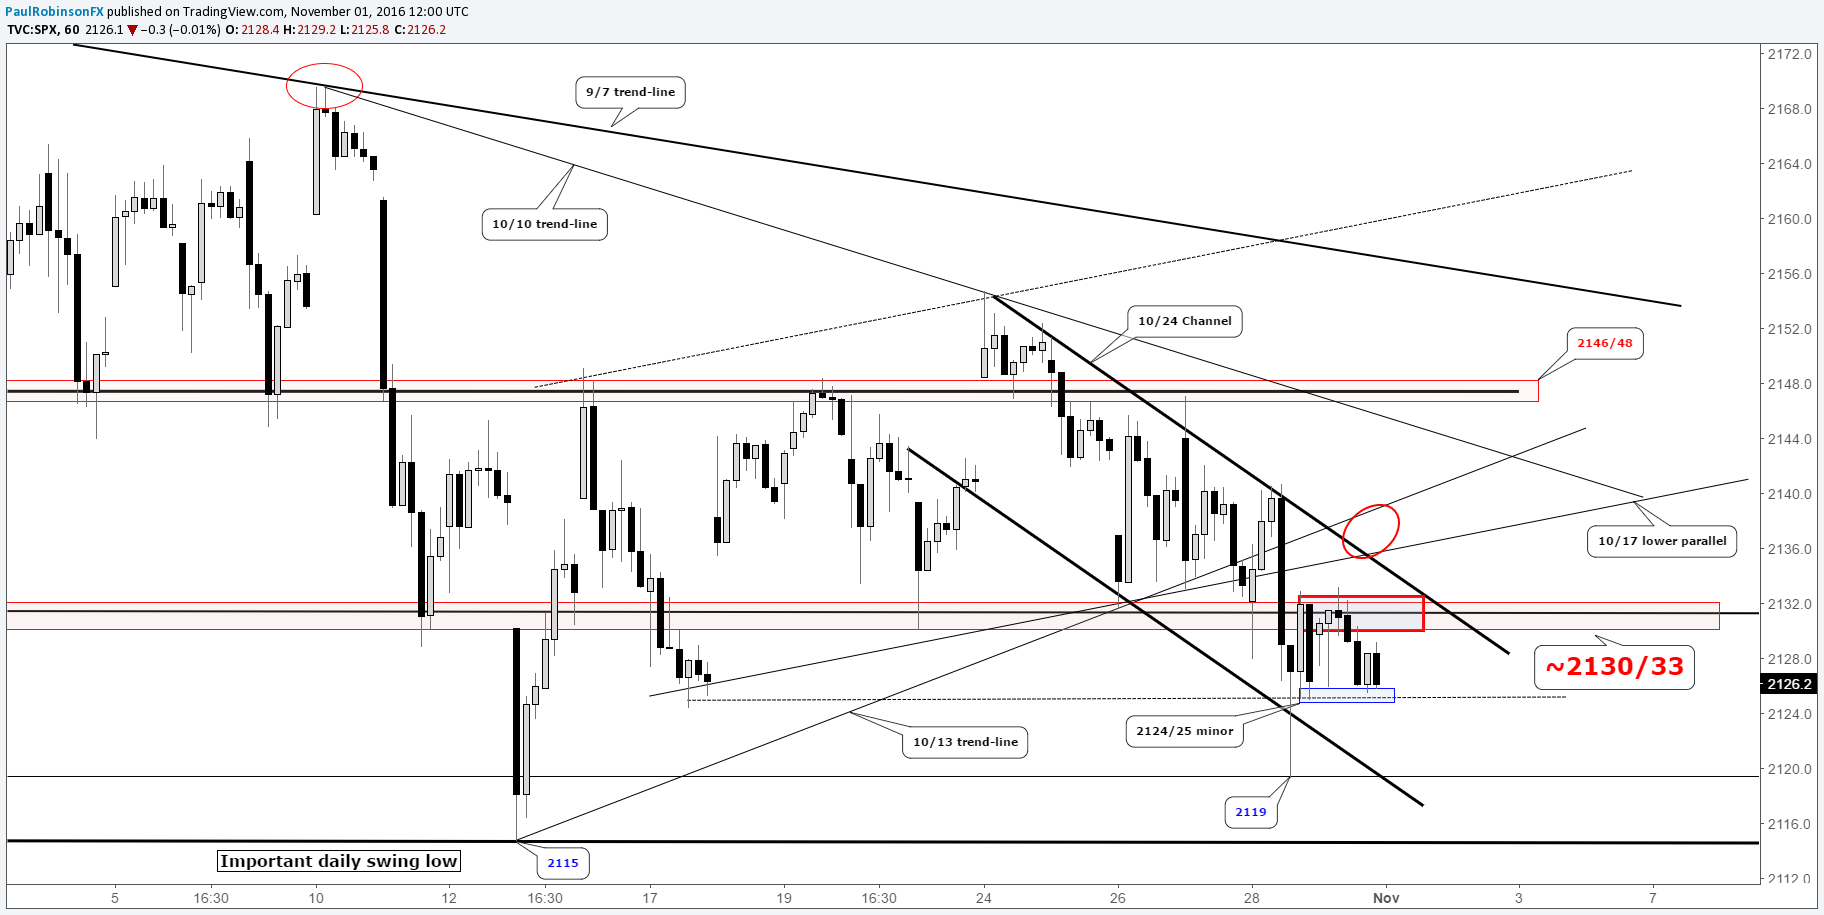
The area surrounding 2130 is proving to be increasingly formidable with the S&P 500 failing to trade above on back-to-back days. If the S&P can move above 2130, we will look to the upper parallel of the 10/24 channel as the next level of resistance (~2134). A couple of handles beyond there lies the 10/17 lower parallel (~2136) and then the backside of the 10/13 trend-line (~2139). Should the market get some pep in its step, the 10/10 trend-line (~2144) comes into play followed by the key 2146/48 area.
Looking to the downside on a hold below the 2130s, we have minor support right around where we closed yesterday at 2124/25, but not looking to it as very meaningful. The next likely support comes in at Friday’s low of 2119 and the lower parallel belonging to the 10/24 channel, then the important daily low at 2115 comes into play. Below 2115 things could get interesting as there is nothing highly visible on the daily chart until perhaps the psych-level at 2100 and lower parallel at around 2093.
S&P 500: 60-min
Created with Tradingview
Nasdaq 100
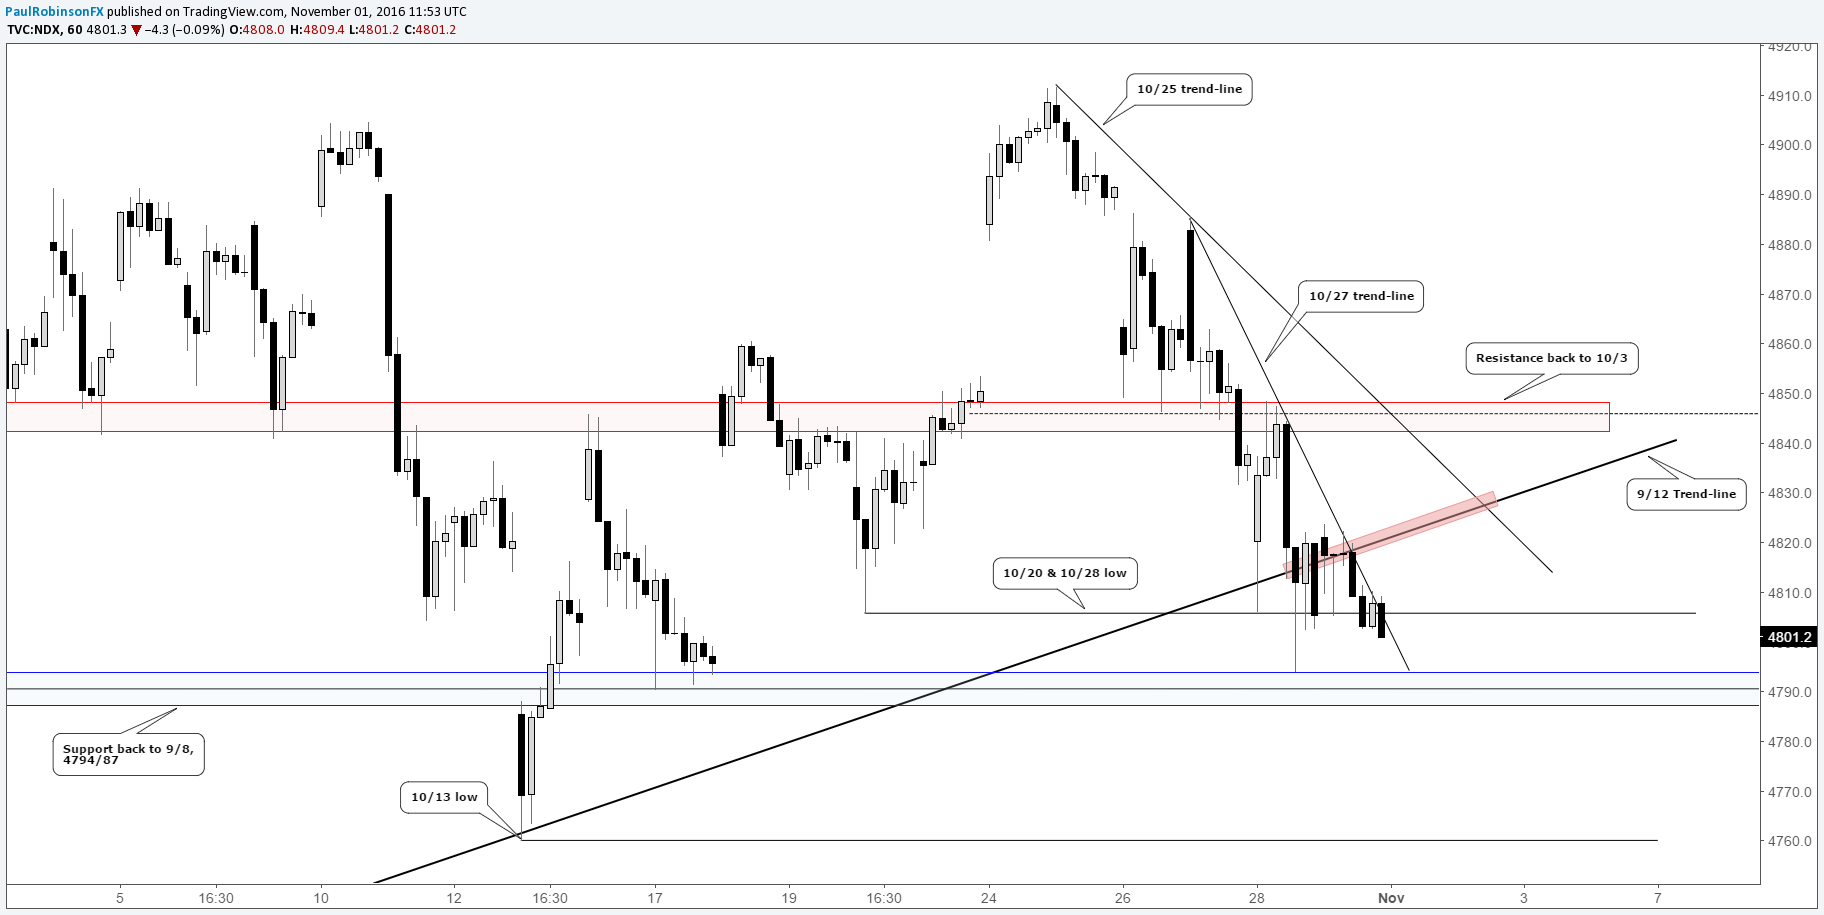
The Naz is sitting below key trend-line resistance running up from the 9/12 swing low, still in a solid downtrend from the 10/25 high. This continues to keep the index pointed lower until it can turn momentum upward and begin arching over key resistance levels. The first level of resistance to maintain is the 10/20, 10/28 lows (4806) and steeply-angled trend-line off the 10/27 gap open high, where the market is treading around now. The first truly meaningful form of resistance comes in at the bottom-side of the 9/12 trend-line (~4820), beyond there the 10/25 trend-line and horizontal resistance running back to 10/3 (both in the ~4040/48 vicinity).
Looking lower, support comes in at the 10/28 low and pivots running back to 9/8 (~4794/87). Below there lies an air pocket down to the 10/13 low at 4760.
Nasdaq 100: 60-min
Created with Tradingview
Check out our Q4 Forecasts and Trading Guides.
---Written by Paul Robinson, Market Analyst
To receive Paul’s analysis directly via email, please sign up here.
You can follow Paul on Twitter at @PaulRobinonFX.
DailyFX provides forex news and technical analysis on the trends that influence the global currency markets.
Learn forex trading with a free practice account and trading charts from FXCM.
