
 Yahoo Finance
 Ollie's Bargain (OLLI) Makes a Mark: Stock Surges 18% YTD

Ollie's Bargain Outlet Holdings, Inc.’s OLLI business model of “buying cheap and selling cheap”, cost-containment efforts, focus on store productivity, sturdy comparable-store sales (comps) performance and expansion of customer reward program, Ollie's Army, fortify its position in the Consumer Staples space. These initiatives positioned the stock to augment both its top and bottom-line performance in the long run.
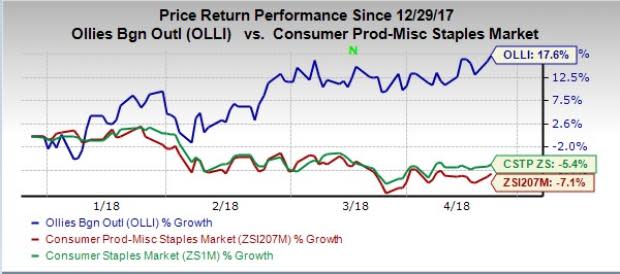
A glimpse of Ollie's Bargain share price movement reveals that it has surged roughly 17.6% so far this year. The stock has not only outperformed the industry that witnessed a decline of 7.1% but also the overall sector that fell 5.4%. Notably, shares of this Harrisburg, PA-based company are hovering in proximity to its 52-week high of $63.75, and there is no doubt why Ollie's Bargain could not breach that mark in the near term.
A Brief Introspection
Ollie's Bargain has an impressive streak of beating quarterly earnings and revenue estimates. The stock has surpassed the Zacks Consensus Estimate for both earnings and revenues in the trailing seven quarters and sustained a decent year-over-year improvement.
In the trailing four quarters, the company has outperformed the consensus mark by an average of 7.7%. In the last reported quarter, the company witnessed a positive earnings surprise of 4.1%. We noted that net sales grew 25.9% to $356.7 million, while adjusted earnings per share surged 30.8% to 51 cents during the fourth quarter of fiscal 2017. Comps increased 4.4% during the quarter under review.
Management now projects net sales growth of 13.2% to 14.1% during fiscal 2018 and envisions adjusted earnings in the band of $1.65-$1.69 per share compared with $1.25 reported in fiscal 2017. Ollie's Bargain now anticipates comps growth of 1-2%. However, we notice that the projected rate of sales growth for fiscal 2018 is down from 21%, what the company attained in fiscal 2017.
Meanwhile, since the announcement of its fourth-quarter results on Apr 4, Ollie's Bargain shares have increased approximately 3.6%.
Certainly, the company’s growth initiatives that involve increasing store count to more than 950 in the long run from its current base of 268 are well on track. Also, the company has been making concerted efforts to lower its debt burden and expects to be debt free by the end of fiscal 2018 with a cash balance of about $70-$80 million.
Valuation Perspective
A glance at some valuation metrics indicates that the stock is trading at a high premium. A Value Score of D also indicates the same. The stock looks expensive with respect to a forward price-to-earnings (P/E) multiple of 37.9x versus industry’s 14.0x. Its price-to-book (P/B) ratio of 4.8 and price-to-sales (P/S) ratio of 3.8 are higher than the industry average of 3.1 and 1.6, respectively. A similar picture emerges when comparing EV/EBITDA ratios. The company’s EV/EBITDA ratio of 36.4 is higher than 16.7 for the industry.
Wrapping Up
Ollie's Bargain strategic endeavors and long-term prospects place the stock favorably on a growth path. However, an expensive valuation along with a possible fall in rate of fiscal 2018 sales growth may make investors rethink before picking this Zacks Rank #3 (Hold) stock.
3 Key Picks
Macy's, Inc. M has a long-term earnings growth rate of 8.5% and a Zacks Rank #1 (Strong Buy). You can see the complete list of today’s Zacks #1 Rank stocks here.
Nordstrom, Inc. JWN with a long-term earnings growth rate of 6% carries a Zacks Rank #2 (Buy).
Kohl's Corporation KSS has a long-term earnings growth rate of 6.7% and a Zacks Rank #2.
Can Hackers Put Money INTO Your Portfolio?
Earlier this year, credit bureau Equifax announced a massive data breach affecting 2 out of every 3 Americans. The cybersecurity industry is expanding quickly in response to this and similar events. But some stocks are better investments than others.
Zacks has just released Cybersecurity! An Investor’s Guide to help Zacks.com readers make the most of the $170 billion per year investment opportunity created by hackers and other threats. It reveals 4 stocks worth looking into right away.
Download the new report now>>
Want the latest recommendations from Zacks Investment Research? Today, you can download 7 Best Stocks for the Next 30 Days. Click to get this free report
Ollie's Bargain Outlet Holdings, Inc. (OLLI) : Free Stock Analysis Report
Nordstrom, Inc. (JWN) : Free Stock Analysis Report
Macy's, Inc. (M) : Free Stock Analysis Report
Kohl's Corporation (KSS) : Free Stock Analysis Report
To read this article on Zacks.com click here.
