
 Yahoo Finance
 Oil and Gold Look to Fed Commentary for Direction Cues
Crude oil and gold prices are looking for FOMC policy guidance as speeches from Kansas City and Atlanta Fed Presidents dominate the economic calendar.
Talking Points
Commodities Look to Fed Commentary to Guide Direction Cues
Gold and Silver Break Below Key Technical Resistance Barriers
Copper Drifts Lower, Crude Tests Back Above the 97.00 Figure
Commodity prices are little-changed in overnight trade, with a thin US economic calendar and flat readings from the risk appetite front (as telegraphed by S&P 500 futures) ahead of the opening bell on Wall Street shifting the spotlight to “Fedspeak” for a possible catalyst. Esther George and Dennis Lockhart, Presidents of the Kansas City and Atlanta Fed branches respectively are scheduled to come across the wires. Both are expected to field questions from the audience, opening the door for the possible emergence of market-driving commentary.
Ms George is perhaps the more significant of the two considering she sits on the rate-setting FOMC committee this year, and traders will be looking closely for any signs of ebbing appetite for monetary stimulus. Such an outcome may open the door for further weakness in gold and silver amid ebbing anti-fiat demand. It is likewise poised to hurt risk appetite and thereby weigh on cycle-sensitive crude oil and copper prices. Needless to say, a strong re-affirmation of the Fed’s dovish credentials may produce the inverse dynamic.
WTI Crude Oil (NY Close): $97.03 // +1.31 // +1.37%
Prices broke lower as expected, taking out the bottom of a Rising Wedge chart formation, after putting in a bearish Dark Cloud Cover candlestick pattern. Initial support remains at 95.14, the 23.6% Fibonacci retracement. That level also looks to be lining up as the neckline to a would-be Head and Shoulders top. A break lower confirmed on a daily closing basis initially exposes the 38.2% level at 93.24 but the H&S setup implies a measured target at 92.07. Near-term resistance at 98.21, marked by the January 30 high.
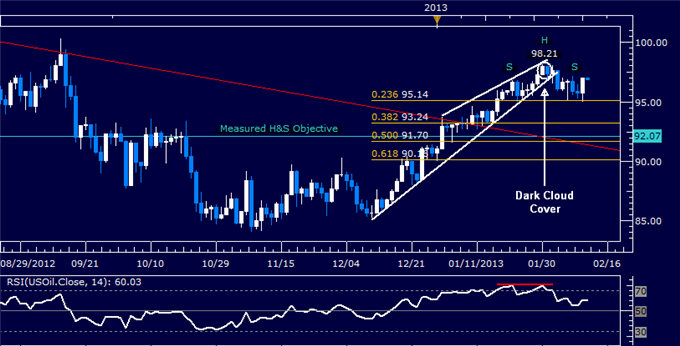
Daily Chart - Created Using FXCM Marketscope 2.0
Spot Gold (NY Close): $1647.95 // -19.25 // -1.15%
Prices broke critical rising trend line support set from mid-May 2012. Sellers are now testing below that 38.2% Fibonacci expansion (1648.20), with a confirmed break exposing the 50% mark at 1633.06. The trend line – now at 1659.90 – has been recast as near-term resistance.
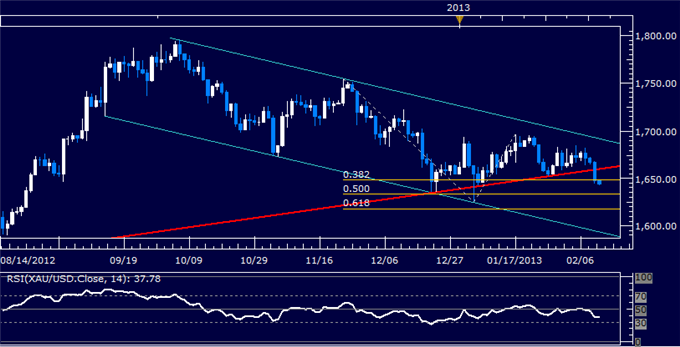
Daily Chart - Created Using FXCM Marketscope 2.0
Want to learn more about RSI? Watch this Video
Spot Silver (NY Close): $30.95 // -0.47 // -1.48%
Prices broke through support at 31.24, marked by the 23.6% Fibonacci expansion and the bottom of a rising channel set from late December. Sellers now target the 38.2% expansion (30.48), with a break below that aiming for the 50% Fib (29.87). The 31.24 level has been recast as near-term resistance.
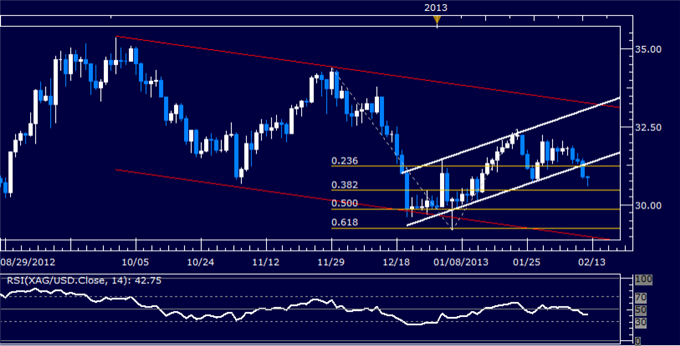
Daily Chart - Created Using FXCM Marketscope 2.0
Want to learn more about RSI? Watch this Video
COMEX E-Mini Copper (NY Close): $3.722 // -0.038 // -1.01%
Prices are turning lower as expected after putting in a Shooting Star candle below resistance at the top of a Rising Wedge chart pattern. Near-term support is at 3.718, the December 10 high, with a break below that aiming for the Wedge bottom at 3.689. The formation’s topside barrier is now at 3.784.

Daily Chart - Created Using FXCM Marketscope 2.0
--- Written by Ilya Spivak, Currency Strategist for Dailyfx.com
To contact Ilya, e-mail ispivak@dailyfx.com. Follow Ilya on Twitter at @IlyaSpivak
To be added to Ilya's e-mail distribution list, please CLICK HERE
DailyFX provides forex news and technical analysis on the trends that influence the global currency markets.
Learn forex trading with a free practice account and trading charts from FXCM.
