
 Yahoo Finance
 NZD/USD Forex Technical Analysis – Momentum Shift Puts Kiwi on Path to .6467
The New Zealand Dollar is edging higher on Friday. The currency is being supported by a weaker U.S. Dollar and a pullback in U.S. Treasury yields. Expectations of an easing of restrictions in Shanghai is another factor supporting this week’s price rise.
At 08:42 GMT, the NZD/USD is trading .6405, up 0.0022 or +0.34%.
Short-sellers are also likely squaring positions ahead of next week’s Reserve Bank of New Zealand (RBNZ) policy meeting. The central bank meets next Wednesday with expectations of another half-point increase to its Official Cash Rate (OCR).
Daily Swing Chart Technical Analysis
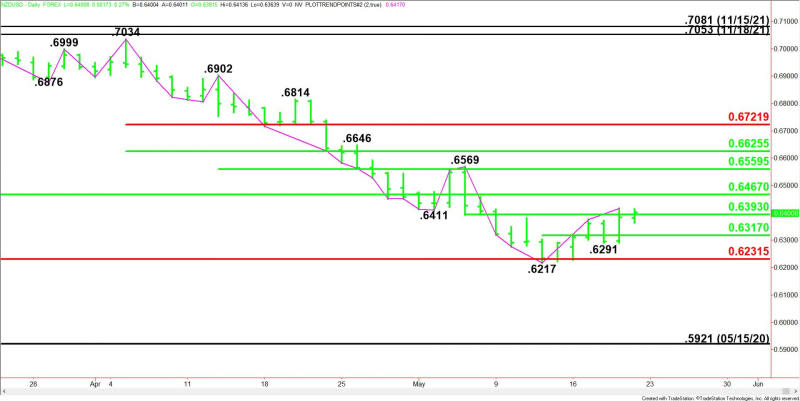
The main trend is down according to the daily swing chart. However, momentum shifted to the upside on Thursday. A trade through .6217 will signal a resumption of the downtrend. A move through .6569 will change the main trend to up.
The minor trend is up. This is controlling the momentum. A trade through .6291 will change the minor trend to down.
The minor range is .6217 to .6417. Its pivot at .6317 is support.
The short-term range is .6569 to .6217. The NZD/USD is currently straddling its pivot at .6393.
The major upside target is the long-term 50% level at .6467. The major support is a long-term Fibonacci level at .6231.
Daily Swing Chart Technical Forecast
Trader reaction to .6393 will likely determine the direction of the NZD/USD on Friday.
Bullish Scenario
A sustained move over .6393 will indicate the presence of buyers. Taking out yesterday’s high at .6417 will indicate the buying is getting stronger. This could trigger a surge into .6467.
Look for sellers on the first test of .6467, but be prepared for a breakout to the upside if counter-trend buyers can overcome this level.
Bearish Scenario
A sustained move under .6393 will signal the presence of sellers. This could trigger a quick pullback into .6317.
Counter-trend buyers could come in on a test of .6317. They will be trying to form a potentially bullish secondary higher bottom. If this level fails to hold then look for a test of the minor bottom at .6291.
A trade through .6291 will shift momentum to the downside, making .6231 to .6217 the next likely targets.
For a look at all of today’s economic events, check out our economic calendar.
This article was originally posted on FX Empire
More From FXEMPIRE:
Juan Carlos met by cheering crowd and political embarrassment on return to Spain
USD/JPY Weekly Price Forecast – The US Dollar Pulls Back Against the Yen
Italy to lend Ukraine 200 million euros, Finance Minister says
Gilinski launches offer for up to 32.5% of Grupo Argos shares
Putin promises to bolster Russia’s IT security in face of cyber attacks
