
 Yahoo Finance
 Nikkei 225 Technical Analysis: 18,000 Key to Watch Going Forward
DailyFX.com -
Talking Points:
- Nikkei 225 broke above trend line resistance from August 2015
- A combination of positive technical signs are encouraging for bulls
- Key resistance still looms as the index approaches the 18,000 handle
If you’re looking for trading ideas, check out our Trading Guides Here
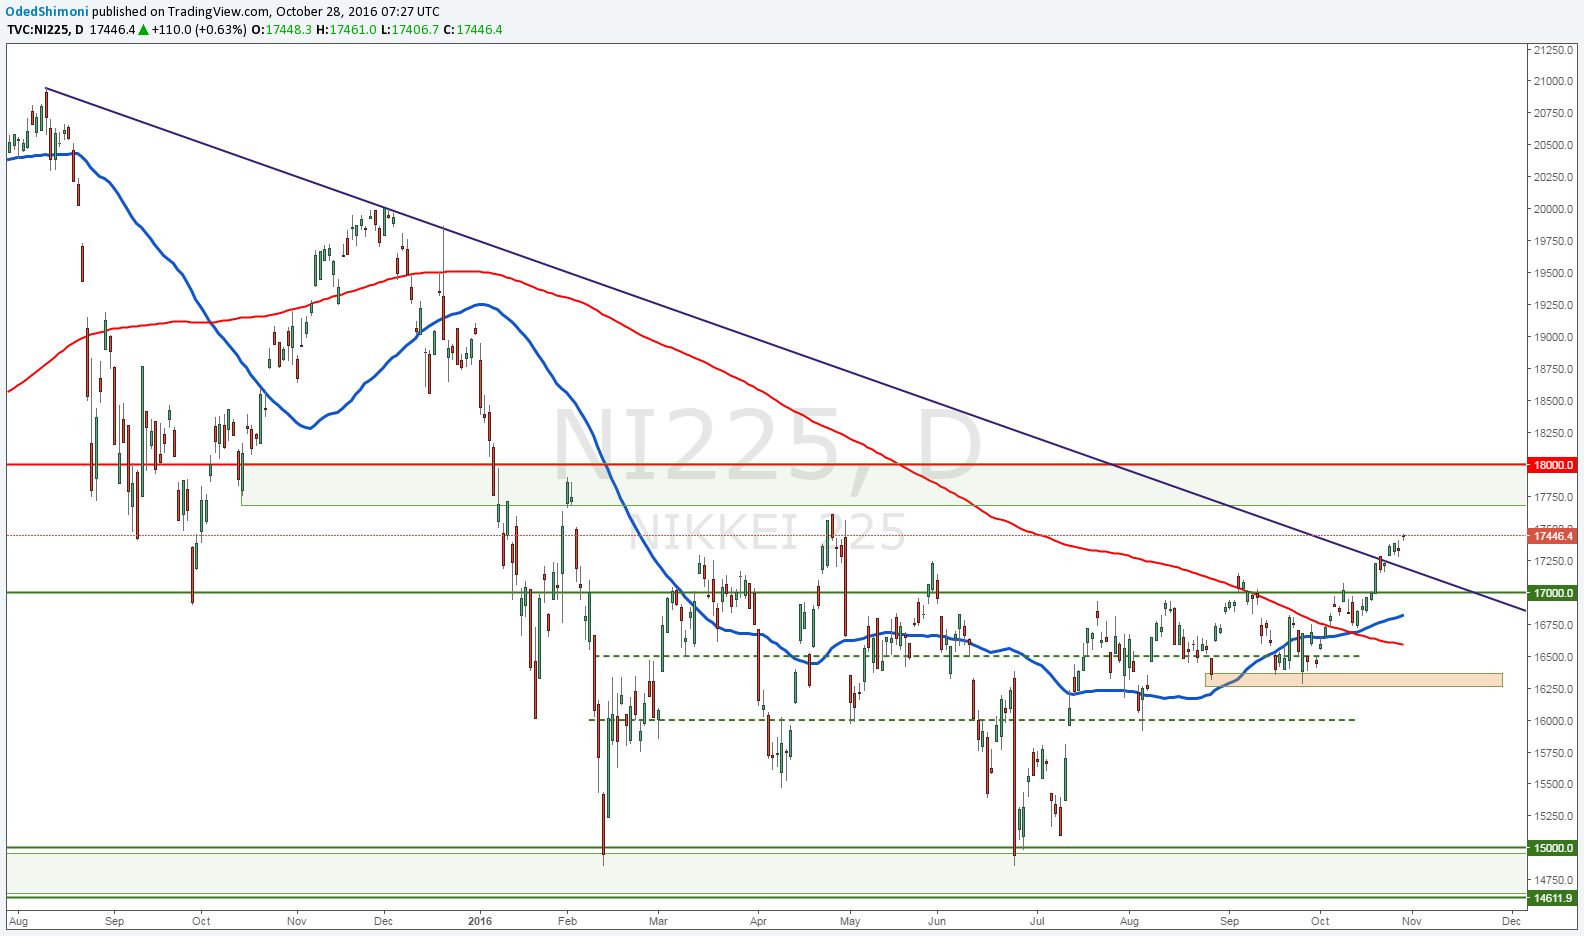
The Nikkei 225 is trading higher after the index managed to clear an important trend line resistance from August 2015.
Nikkei prices have been ranging between the well-defined 18,000 resistance zone and the 15,000 support since the start of the year, with gains appearing to be corrective in the context of the near term down trend from June 2015 highs.
With that said, a confluence of bullish technical signs are proving encouraging for bulls: the 50 day moving average crossed over the 200 MA, and breakouts from key levels such as the 17,000 handle and the aforementioned trend line resistance are implying strength on the upside.
Taken together, this may shift our focus for the larger hurdle which is the resistance zone below 18,000. If bulls can clear that area, it appears like they can establish full control to mount a perceived resumption of the longer term weekly uptrend.
Levels of support on a move to the downside could be 17,000 followed by the 16,500 level.
Nikkei 225 Daily Chart: October 28, 2016
--- Written by Oded Shimoni, Junior Currency Analyst for DailyFX.com
To contact Oded Shimoni, e-mail oshimoni@dailyfx.com
Follow him on Twitter at @OdedShimoni
DailyFX provides forex news and technical analysis on the trends that influence the global currency markets.
Learn forex trading with a free practice account and trading charts from FXCM.
