
 Yahoo Finance
Missing out on the wrong weeks of the STI can cost you – big time

It’s not about market timing – but time in the market. “Buy low, sell high” is the most basic – and also the least possible – stock market investment advice. Some people can get close to a stock’s, or market’s, highs and lows, some of the time. But doing it consistently over time is impossible. Markets are volatile – they twist and turn like rollercoasters. And if your timing is off, and you miss the weeks where the market posts its strongest returns, you can do enormous harm to your overall returns. Missing the best weeks We looked at the weekly performance of Singapore’s Straits Times Index’s (STI) since January1988. We then looked at how your portfolio performance would change if you missed some of the weeks when the market performed most strongly. The theory here is simple – if you stay invested long enough, you’ll experience horribly bad weeks as well as some remarkably strong weeks. And the good weeks will, on average, make up for the bad ones. Since January 1988, the STI has had 1,487 trading weeks. Since then, it’s returned 220% in local currency terms (not including dividends), posting an average annual return of 4.2% (and average weekly returns of 0.08%). The table below shows what would have happened if you had been invested during the entire period – except for the best-performing weeks. If you missed just the single best week of market performance since 1988 (which was the end of January/beginning of February 1998, during which the STI appreciated 22%), your accumulated returns over the past 28 years would have been 26 percent less than if you had been invested during that week. (Note that if you had missed out on that great week, your portfolio would also have missed out on the effect of compounding. That’s why the total return at the end of the period would be so much less than just the 13.6 percent return you’d have missed out on.) Similarly, an investor who missed just the best five trading weeks of the entire period (or, in other words, who was invested for 99.7% of the entire 1,487-week period) would have seen his average annual returns decline from 4.2% (for 100% of the period), to just 1.8%.
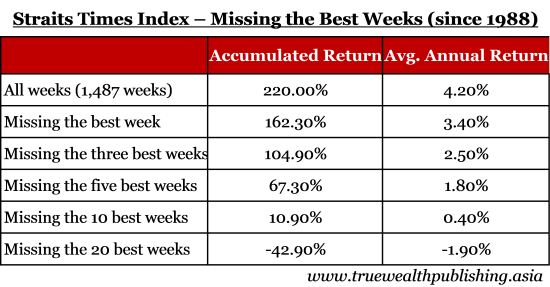
And missing the 20 best-performing weeks of trading (or 1.3% of the entire period) would have resulted in a loss of almost 43%. All of the positive performance of the STI since 1988 is accountable in just 11 weeks. (Note: These figures reflect actual index performance, excluding dividends. Investing in the STI using an index fund or ETF, like the SPDR Straits Times Index ETF (code: ES3), would have slightly different performance numbers because of ETF fees and trading commissions.) Most investors are afraid of losing money from falling markets. But what this shows is that investors should be most afraid of losing money by missing out on the best days of market performance. Miss the best weeks, miss returns To put it in perspective, the figure below shows what these annual returns look like compared to the average returns earned on a one-year Singapore Treasury bill – one of the safest, lowest yielding investments available.
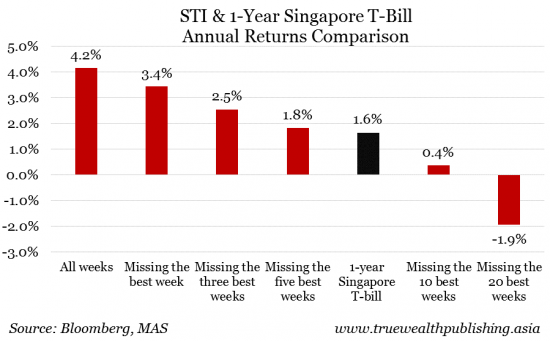
So, if you missed the 10 best weeks of STI performance out of the past 28 years (or just 0.7% of the past 1,487 weeks) you would have earned a quarter of the average return of 1-year T-bills. Missing the 20 best weeks (or, just 1.3% of all weeks) would have not only earned you 3.5 percentage points less than a T-bill – and you would have lost money. In fact, missing just the best five weeks would have barely made you more than T-bills since 1988. Of course, the fewer best weeks missed, the better your overall performance. When the best weeks happen That’s not all. Things get more interesting when you take a look at when the best 20 weeks occur.

It just shows that the best weeks often follow really bad weeks. So panicking and selling when the market has a bad week is one of the worst things you can do.What this means is that when the STI moves below its 40-week moving average (that is, its average level for the previous 40 weeks), the best performing weeks often follow. For instance, two of the three best performing weeks have come after the STI drops below its 40-week average. And half of the best 20 weeks came after the STI posted below-average weekly performance. This also shows that one of the best ways to make money in the markets is to stay invested in the markets. The longer you stay invested, the higher your chances of experiencing the best weeks. Granted, you’ll also have to bear the worst weeks. But the risk of trying to time the market – by avoiding the bad weeks – is that you’ll miss out on the good weeks. So don’t be afraid of bad market days or weeks. What you should really be afraid of is missing out on the really good weeks.
