
 Yahoo Finance
 Millennium Services Group Limited (ASX:MIL): Time For A Financial Health Check

While small-cap stocks, such as Millennium Services Group Limited (ASX:MIL) with its market cap of AU$44.55M, are popular for their explosive growth, investors should also be aware of their balance sheet to judge whether the company can survive a downturn. Assessing first and foremost the financial health is crucial, as mismanagement of capital can lead to bankruptcies, which occur at a higher rate for small-caps. Here are a few basic checks that are good enough to have a broad overview of the company’s financial strength. However, I know these factors are very high-level, so I suggest you dig deeper yourself into MIL here.
Does MIL generate enough cash through operations?
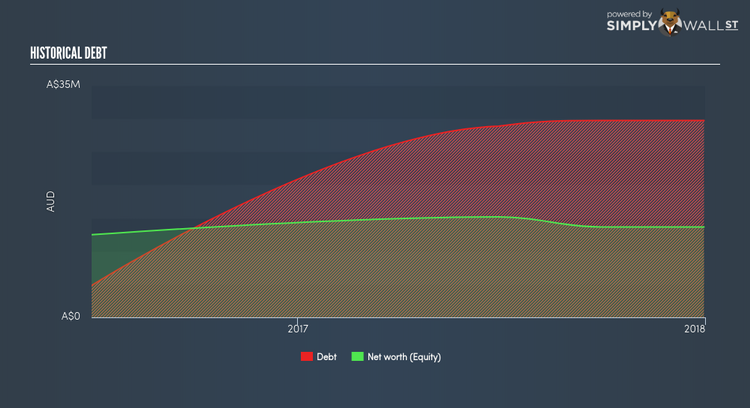
Over the past year, MIL has ramped up its debt from AU$4.81M to AU$28.89M , which comprises of short- and long-term debt. With this rise in debt, the current cash and short-term investment levels stands at AU$8.06M , ready to deploy into the business. Moreover, MIL has generated AU$10.87M in operating cash flow during the same period of time, leading to an operating cash to total debt ratio of 37.64%, meaning that MIL’s operating cash is sufficient to cover its debt. This ratio can also be interpreted as a measure of efficiency as an alternative to return on assets. In MIL’s case, it is able to generate 0.38x cash from its debt capital.
Can MIL meet its short-term obligations with the cash in hand?
Looking at MIL’s most recent AU$37.95M liabilities, it appears that the company has not been able to meet these commitments with a current assets level of AU$27.57M, leading to a 0.73x current account ratio. which is under the appropriate industry ratio of 3x.
Does MIL face the risk of succumbing to its debt-load?
Since total debt levels have outpaced equities, MIL is a highly leveraged company. This is not uncommon for a small-cap company given that debt tends to be lower-cost and at times, more accessible. We can check to see whether MIL is able to meet its debt obligations by looking at the net interest coverage ratio. A company generating earnings before interest and tax (EBIT) at least three times its net interest payments is considered financially sound. In MIL’s, case, the ratio of 3.8x suggests that interest is appropriately covered, which means that lenders may be less hesitant to lend out more funding as MIL’s high interest coverage is seen as responsible and safe practice.
Next Steps:
Although MIL’s debt level is towards the higher end of the spectrum, its cash flow coverage seems adequate to meet debt obligations which means its debt is being efficiently utilised. Though its low liquidity raises concerns over whether current asset management practices are properly implemented for the small-cap. Keep in mind I haven’t considered other factors such as how MIL has been performing in the past. You should continue to research Millennium Services Group to get a more holistic view of the stock by looking at:
Future Outlook: What are well-informed industry analysts predicting for MIL’s future growth? Take a look at our free research report of analyst consensus for MIL’s outlook.
Valuation: What is MIL worth today? Is the stock undervalued, even when its growth outlook is factored into its intrinsic value? The intrinsic value infographic in our free research report helps visualize whether MIL is currently mispriced by the market.
Other High-Performing Stocks: Are there other stocks that provide better prospects with proven track records? Explore our free list of these great stocks here.
To help readers see pass the short term volatility of the financial market, we aim to bring you a long-term focused research analysis purely driven by fundamental data. Note that our analysis does not factor in the latest price sensitive company announcements.
The author is an independent contributor and at the time of publication had no position in the stocks mentioned.
