
 Yahoo Finance
 Marriott (MAR) Q1 Earnings & Revenues Top Estimates, Rise Y/Y
Marriott International, Inc. MAR reported impressive first-quarter 2023 results, with earnings and revenues surpassing the Zacks Consensus Estimate. The top and the bottom line increased on a year-over-year basis. Following the results, the company’s shares are up 1.8% in the pre-market trading session.
During the quarter, the company benefited from robust leisure demand, solid global booking trends and easing travel restrictions throughout Asia Pacific (particularly in Greater China). Also, it reported a strong revenue per available room (RevPAR) growth in international markets. With global trends improving, the company expects the growth momentum to continue in the upcoming periods. The company is optimistic on account of its portfolio of brands, loyalty program and asset-light business model.
Earnings & Revenue Discussion
In the quarter under review, Marriott’s adjusted earnings per share (EPS) were $2.09, surpassing the Zacks Consensus Estimate of $1.86. In the prior-year quarter, the company reported adjusted earnings of $1.25 per share.
Marriott International, Inc. Price, Consensus and EPS Surprise
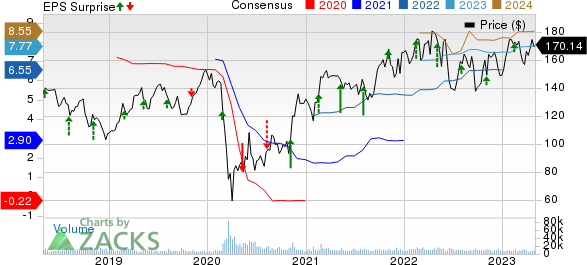
Marriott International, Inc. price-consensus-eps-surprise-chart | Marriott International, Inc. Quote
Quarterly revenues of $5,615 million surpassed the consensus mark of $5,276 million. The top line surged 33.7% on a year-over-year basis. During the quarter, revenues from Base management and Franchise fee came in at $293 million and $639 million compared with $213 million and $500 million reported in the prior-year quarter. The upside was primarily backed by RevPAR increases and unit growth. During the quarter, other non-RevPAR-related franchise fees came in at $197 million compared with $170 million reported in the year-ago quarter. The upside was primarily driven by solid contributions from co-brand credit card fees and residential branding fees.
RevPAR & Margins
In the quarter under review, RevPAR for worldwide comparable system-wide properties increased 34.3% (in constant dollars) from 2022 levels. The upside was primarily backed by a 11.3% increase in ADR from 2022 levels. Meanwhile, occupancy increased 11.2% from 2022 levels.
Comparable system-wide RevPAR in the Asia Pacific (excluding China) increased 112.8% (in constant dollars) year over year. Occupancy increased 23.1% year over year, while ADR increased 39.9% from 2022 levels. Comparable system-wide RevPAR in Greater China increased 78.3% year over year.
On a constant-dollar basis, international comparable system-wide RevPAR increased 63.1% from 2022 levels. Occupancy gained 18.3% year over year, while ADR was up 16.4% from 2022 levels. Comparable system-wide RevPAR in Europe increased 75.6%, while RevPAR in the Caribbean & Latin America increased 40.9% from 2022 levels.
Total expenses during the quarter increased 28.1% year over year to $4,664 million, primarily owing to a rise in Reimbursed expenses.
During the first quarter, adjusted earnings before interest, taxes, depreciation and amortization (EBITDA) amounted to $1,098 million compared with $759 million reported in the prior-year quarter.
Balance sheet
At the end of the first quarter, Marriott's total debt amounted to $10.7 billion compared with $10.1 billion reported in the previous quarter. Cash and cash equivalents, as of Mar 31, 2023, came in at $0.6 billion compared with $0.5 billion reported in the previous quarter.
Year to date (through Apr 28, 2023), the company repurchased 8.2 million shares of its common stock worth $1.4 billion.
Unit Developments
At the end of first-quarter 2022, Marriott's development pipeline totaled 3,060 hotels, with approximately 502,000 rooms. Nearly 200,000 rooms were under construction.
During the quarter, the company added 79 new properties (11,015 rooms) to its worldwide lodging portfolio. For 2023, the company anticipates net room growth in the range of 4-4.5% year over year.
Outlook
For second-quarter 2023, the company anticipates gross fee revenues in the range of $1,205-$1,225 million. Adjusted EBITDA is expected between $1,140 million and $1,165 million. The company expects second-quarter diluted EPS to be between $2.09 and $2.15.
For the second quarter, the company anticipates worldwide system-wide RevPAR to increase 10-12% growth from 2022 levels. RevPAR in the United States and Canada is expected to increase 5-7% from 2022 levels. International RevPAR is expected in the range of 27-29% from 2022 levels. The company anticipates worldwide system-wide RevPAR in 2023 to increase 10-13% year over year compared with the previous growth expectations of 6-11% year over year.
For 2023, the company anticipates gross fee revenues in the range of $4,600-$4,750 million. General and administrative expenses for 2023 are projected between $935 million and $915 million. Adjusted EBITDA is expected between $4,360 million to $4,540 million. It projects 2023 diluted EPS in the range of $7.97-$8.42, up from the previous expectation of $7.23-$7.91.
Zacks Rank & Other Key Picks
Marriott currently carries a Zacks Rank #2 (Buy).
Some other top-ranked stocks in the Zacks Consumer Discretionary sector are Boyd Gaming Corporation BYD, Crocs, Inc. CROX and PlayAGS, Inc. AGS.
Boyd Gaming currently sports a Zacks Rank #1 (Strong Buy). BYD has a trailing four-quarter earnings surprise of 13.7%, on average. Shares of BYD have gained 16.9% in the past year. You can see the complete list of today’s Zacks #1 Rank stocks here.
The Zacks Consensus Estimate for BYD’s 2023 sales and EPS indicates a rise of 1.4% and 2.8%, respectively, from the year-ago period’s levels.
Crocs carries a Zacks Rank #2. The company has a trailing four-quarter earnings surprise of 19.6%, on average. Shares of Crocs have increased 70.5% in the past year.
The Zacks Consensus Estimate for CROX’s 2023 sales and EPS indicates a rise of 13% and 5.6%, respectively, from the year-ago period’s levels.
PlayAGS carries a Zacks Rank #2. The company has a trailing four-quarter earnings surprise of 133.3%, on average. The stock has declined 18.5% in the past year.
The Zacks Consensus Estimate for AGS 2024 sales and EPS indicates a rise of 3% and 1,873.3%, respectively, from the year-ago period’s estimated levels.
Want the latest recommendations from Zacks Investment Research? Today, you can download 7 Best Stocks for the Next 30 Days. Click to get this free report
Marriott International, Inc. (MAR) : Free Stock Analysis Report
Boyd Gaming Corporation (BYD) : Free Stock Analysis Report
Crocs, Inc. (CROX) : Free Stock Analysis Report
PlayAGS, Inc. (AGS) : Free Stock Analysis Report
