
 Yahoo Finance
 What Makes DCM Shriram Limited (NSE:DCMSHRIRAM) A Great Dividend Stock?

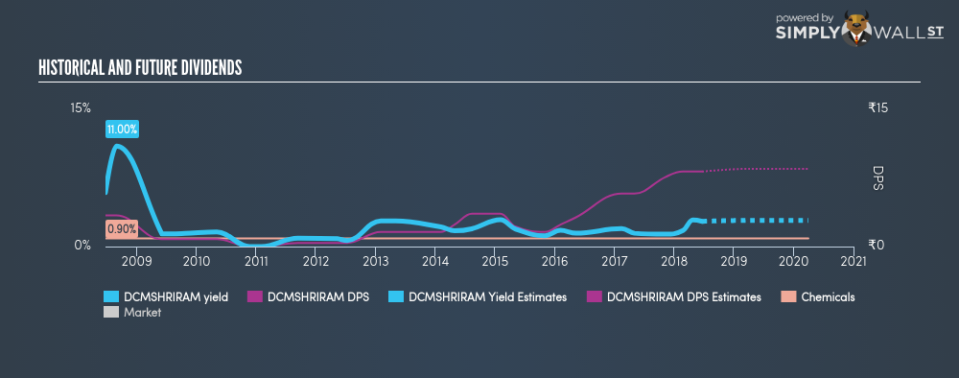
There is a lot to be liked about DCM Shriram Limited (NSE:DCMSHRIRAM) as an income stock, over the past 10 years it has returned an average of 2.00% per year. The stock currently pays out a dividend yield of 2.76%, and has a market cap of ₹49.68b. Let’s dig deeper into whether DCM Shriram should have a place in your portfolio. View out our latest analysis for DCM Shriram
5 checks you should use to assess a dividend stock
If you are a dividend investor, you should always assess these five key metrics:
Is their annual yield among the top 25% of dividend payers?
Has its dividend been stable over the past (i.e. no missed payments or significant payout cuts)?
Has dividend per share risen in the past couple of years?
Is its earnings sufficient to payout dividend at the current rate?
Based on future earnings growth, will it be able to continue to payout dividend at the current rate?
Does DCM Shriram pass our checks?
The company currently pays out 19.89% of its earnings as a dividend, according to its trailing twelve-month data, which means that the dividend is covered by earnings. Going forward, analysts expect DCMSHRIRAM’s payout to remain around the same level at 21.37% of its earnings, which leads to a dividend yield of around 2.86%. Furthermore, EPS is forecasted to fall to ₹33.4 in the upcoming year.
If there is one thing that you want to be reliable in your life, it’s dividend stocks and their constant income stream. Although DCMSHRIRAM’s per share payments have increased in the past 10 years, it has not been a completely smooth ride. Investors have seen reductions in the dividend per share in the past, although, it has picked up again.
Compared to its peers, DCM Shriram produces a yield of 2.76%, which is high for Chemicals stocks.
Next Steps:
With this in mind, I definitely rank DCM Shriram as a strong dividend stock, and makes it worth further research for anyone who likes steady income generation from their portfolio. Given that this is purely a dividend analysis, you should always research extensively before deciding whether or not a stock is an appropriate investment for you. I always recommend analysing the company’s fundamentals and underlying business before making an investment decision. There are three important aspects you should look at:
Future Outlook: What are well-informed industry analysts predicting for DCMSHRIRAM’s future growth? Take a look at our free research report of analyst consensus for DCMSHRIRAM’s outlook.
Valuation: What is DCMSHRIRAM worth today? Even if the stock is a cash cow, it’s not worth an infinite price. The intrinsic value infographic in our free research report helps visualize whether DCMSHRIRAM is currently mispriced by the market.
Other Dividend Rockstars: Are there better dividend payers with stronger fundamentals out there? Check out our free list of these great stocks here.
To help readers see pass the short term volatility of the financial market, we aim to bring you a long-term focused research analysis purely driven by fundamental data. Note that our analysis does not factor in the latest price sensitive company announcements.
The author is an independent contributor and at the time of publication had no position in the stocks mentioned.
