Mühlbauer Holding (ETR:MUB) Will Want To Turn Around Its Return Trends
If you're not sure where to start when looking for the next multi-bagger, there are a few key trends you should keep an eye out for. Firstly, we'll want to see a proven return on capital employed (ROCE) that is increasing, and secondly, an expanding base of capital employed. If you see this, it typically means it's a company with a great business model and plenty of profitable reinvestment opportunities. Although, when we looked at Mühlbauer Holding (ETR:MUB), it didn't seem to tick all of these boxes.
What Is Return On Capital Employed (ROCE)?
Just to clarify if you're unsure, ROCE is a metric for evaluating how much pre-tax income (in percentage terms) a company earns on the capital invested in its business. Analysts use this formula to calculate it for Mühlbauer Holding:
Return on Capital Employed = Earnings Before Interest and Tax (EBIT) ÷ (Total Assets - Current Liabilities)
0.04 = €24m ÷ (€605m - €3.4m) (Based on the trailing twelve months to June 2023).
Thus, Mühlbauer Holding has an ROCE of 4.0%. In absolute terms, that's a low return and it also under-performs the Machinery industry average of 11%.
View our latest analysis for Mühlbauer Holding
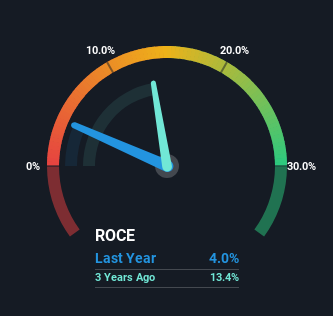
Historical performance is a great place to start when researching a stock so above you can see the gauge for Mühlbauer Holding's ROCE against it's prior returns. If you'd like to look at how Mühlbauer Holding has performed in the past in other metrics, you can view this free graph of Mühlbauer Holding's past earnings, revenue and cash flow.
What Does the ROCE Trend For Mühlbauer Holding Tell Us?
On the surface, the trend of ROCE at Mühlbauer Holding doesn't inspire confidence. To be more specific, ROCE has fallen from 14% over the last five years. Although, given both revenue and the amount of assets employed in the business have increased, it could suggest the company is investing in growth, and the extra capital has led to a short-term reduction in ROCE. If these investments prove successful, this can bode very well for long term stock performance.
On a related note, Mühlbauer Holding has decreased its current liabilities to 0.6% of total assets. So we could link some of this to the decrease in ROCE. Effectively this means their suppliers or short-term creditors are funding less of the business, which reduces some elements of risk. Since the business is basically funding more of its operations with it's own money, you could argue this has made the business less efficient at generating ROCE.
What We Can Learn From Mühlbauer Holding's ROCE
In summary, despite lower returns in the short term, we're encouraged to see that Mühlbauer Holding is reinvesting for growth and has higher sales as a result. And the stock has followed suit returning a meaningful 49% to shareholders over the last five years. So while investors seem to be recognizing these promising trends, we would look further into this stock to make sure the other metrics justify the positive view.
If you'd like to know more about Mühlbauer Holding, we've spotted 4 warning signs, and 1 of them makes us a bit uncomfortable.
If you want to search for solid companies with great earnings, check out this free list of companies with good balance sheets and impressive returns on equity.
Have feedback on this article? Concerned about the content? Get in touch with us directly. Alternatively, email editorial-team (at) simplywallst.com.
This article by Simply Wall St is general in nature. We provide commentary based on historical data and analyst forecasts only using an unbiased methodology and our articles are not intended to be financial advice. It does not constitute a recommendation to buy or sell any stock, and does not take account of your objectives, or your financial situation. We aim to bring you long-term focused analysis driven by fundamental data. Note that our analysis may not factor in the latest price-sensitive company announcements or qualitative material. Simply Wall St has no position in any stocks mentioned.