
 Yahoo Finance
 Is Luxking Group Holdings Limited (SGX:BKK) A Financially Sound Company?

While small-cap stocks, such as Luxking Group Holdings Limited (SGX:BKK) with its market cap of S$4.36M, are popular for their explosive growth, investors should also be aware of their balance sheet to judge whether the company can survive a downturn. Assessing first and foremost the financial health is crucial, since poor capital management may bring about bankruptcies, which occur at a higher rate for small-caps. Here are few basic financial health checks you should consider before taking the plunge. Though, since I only look at basic financial figures, I’d encourage you to dig deeper yourself into BKK here.
Does BKK generate an acceptable amount of cash through operations?
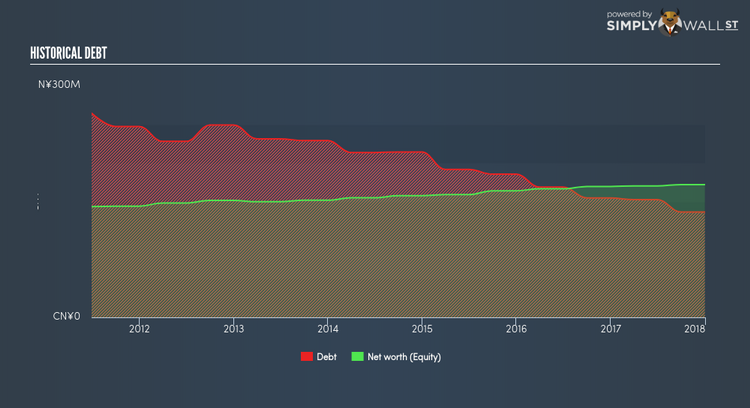
BKK has shrunken its total debt levels in the last twelve months, from CN¥168.65M to CN¥152.38M , which is made up of current and long term debt. With this reduction in debt, the current cash and short-term investment levels stands at CN¥19.67M for investing into the business. Additionally, BKK has produced CN¥25.01M in operating cash flow over the same time period, leading to an operating cash to total debt ratio of 16.41%, indicating that BKK’s debt is not appropriately covered by operating cash. This ratio can also be a sign of operational efficiency as an alternative to return on assets. In BKK’s case, it is able to generate 0.16x cash from its debt capital.
Can BKK pay its short-term liabilities?
With current liabilities at CN¥151.22M, it seems that the business has been able to meet these obligations given the level of current assets of CN¥267.74M, with a current ratio of 1.77x. For Commercial Services companies, this ratio is within a sensible range since there is a bit of a cash buffer without leaving too much capital in a low-return environment.
Does BKK face the risk of succumbing to its debt-load?
With a debt-to-equity ratio of 79.27%, BKK can be considered as an above-average leveraged company. This is not unusual for small-caps as debt tends to be a cheaper and faster source of funding for some businesses. We can test if BKK’s debt levels are sustainable by measuring interest payments against earnings of a company. Ideally, earnings before interest and tax (EBIT) should cover net interest by at least three times. For BKK, the ratio of 1.77x suggests that interest is not strongly covered, which means that lenders may be more reluctant to lend out more funding as BKK’s low interest coverage already puts the company at higher risk of default.
Next Steps:
BKK’s debt and cash flow levels indicate room for improvement. Its cash flow coverage of less than a quarter of debt means that operating efficiency could be an issue. However, the company exhibits proper management of current assets and upcoming liabilities. Keep in mind I haven’t considered other factors such as how BKK has been performing in the past. You should continue to research Luxking Group Holdings to get a better picture of the stock by looking at:
Valuation: What is BKK worth today? Is the stock undervalued, even when its growth outlook is factored into its intrinsic value? The intrinsic value infographic in our free research report helps visualize whether BKK is currently mispriced by the market.
Historical Performance: What has BKK’s returns been like over the past? Go into more detail in the past track record analysis and take a look at the free visual representations of our analysis for more clarity.
Other High-Performing Stocks: Are there other stocks that provide better prospects with proven track records? Explore our free list of these great stocks here.
To help readers see pass the short term volatility of the financial market, we aim to bring you a long-term focused research analysis purely driven by fundamental data. Note that our analysis does not factor in the latest price sensitive company announcements.
The author is an independent contributor and at the time of publication had no position in the stocks mentioned.
