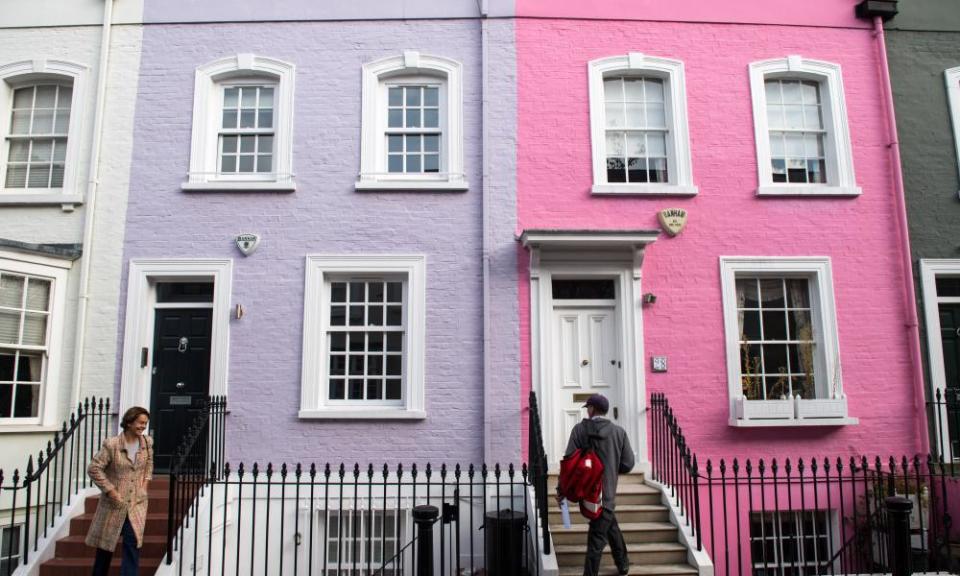
London property slump puts brake on UK house price growth

UK house price growth slowed in June to the lowest annual rate in five years, driven by falling prices in London, according to official figures.
Average house prices across the country increased 3% in the year to June, down from a 3.5% gain in May, the lowest annual rate since August 2013, the Office for National Statistics (ONS) said. The average price of a UK home was £228,000 – about £6,000 higher than in June 2017 and £1,000 higher than in May.
However, the slowdown is hitting London hardest. House prices in the capital fell at the fastest annual rate since the depths of the financial crisis, while rents dropped at the fastest rate in eight years, said the ONS.
The ONS said the UK-wide dip in growth was driven mainly by a slowdown in the south and east of England. London recorded the weakest reading across the country, with prices dropping 0.7% over the year to June, the lowest rate since September 2009, and down 0.2% in May. It is the fifth month London house prices have fallen this year.
The annual UK growth rate has slowed steadily since summer 2016 and has remained below 5% throughout 2017 and 2018, with the exception of October 2017.
The second-lowest annual growth was in the north-east, where prices dropped 0.6% in the year to June. Prices are still growing strongly in other areas of the country, led by the West Midlands where prices rose by 5.8%, and the east Midlands with 4.1% annual growth.
Semi-detached houses showed the biggest increase, with prices up 4.4% to £216,000 in the year to June. The average price of flats and maisonettes rose by 0.5% to £204,000, marking the lowest annual growth of all property types. This was driven by price falls in London, which accounts for a quarter of all UK flats and maisonette sales.
The ONS also released data on rents. Private rents rose 0.9% in Britain in the year to July, down slightly from an annual rate of 1% in the 12 months to June.
In England, private rents grew by 0.9%, Wales recorded growth of 1% while Scotland experienced a rental price rise of 0.5%. Rents in London fell 0.3%, marking the lowest annual rate since September 2010.
Jeremy Leaf, a London estate agent and a former RICS residential chairman, said: “House price growth outside of London is being supported by a continuing shortage of stock whereas the capital and the south-east can’t hide behind this excuse any longer. Price drops are continuing and reflect a new realism in the market – if you want to sell your property, it needs to stand out and price is the obvious way of doing it.”

 Yahoo Finance