
 Yahoo Finance
 Can LHT Holdings Limited’s (SGX:BEI) ROE Continue To Surpass The Industry Average?

The content of this article will benefit those of you who are starting to educate yourself about investing in the stock market and looking to gauge the potential return on investment in LHT Holdings Limited (SGX:BEI).
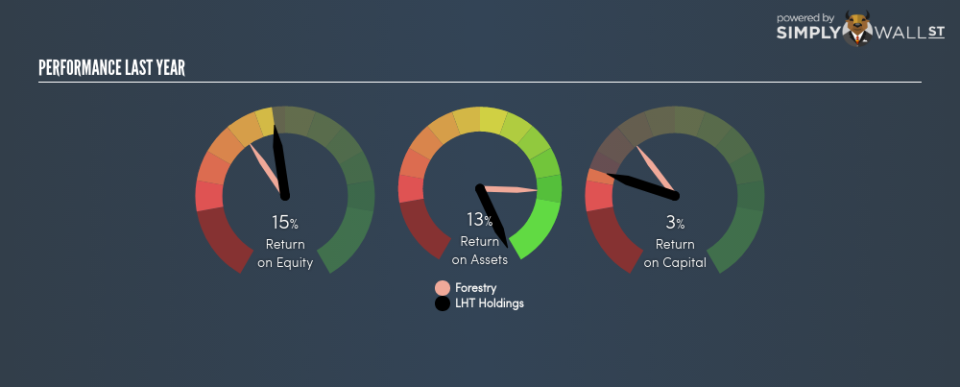
LHT Holdings Limited (SGX:BEI) outperformed the Forest Products industry on the basis of its ROE – producing a higher 14.64% relative to the peer average of 12.26% over the past 12 months. Superficially, this looks great since we know that BEI has generated big profits with little equity capital; however, ROE doesn’t tell us how much BEI has borrowed in debt. We’ll take a closer look today at factors like financial leverage to determine whether BEI’s ROE is actually sustainable. Check out our latest analysis for LHT Holdings
Breaking down Return on Equity
Return on Equity (ROE) weighs LHT Holdings’s profit against the level of its shareholders’ equity. For example, if the company invests SGD1 in the form of equity, it will generate SGD0.15 in earnings from this. In most cases, a higher ROE is preferred; however, there are many other factors we must consider prior to making any investment decisions.
Return on Equity = Net Profit ÷ Shareholders Equity
ROE is measured against cost of equity in order to determine the efficiency of LHT Holdings’s equity capital deployed. Its cost of equity is 8.51%. Given a positive discrepancy of 6.13% between return and cost, this indicates that LHT Holdings pays less for its capital than what it generates in return, which is a sign of capital efficiency. ROE can be broken down into three different ratios: net profit margin, asset turnover, and financial leverage. This is called the Dupont Formula:
Dupont Formula
ROE = profit margin × asset turnover × financial leverage
ROE = (annual net profit ÷ sales) × (sales ÷ assets) × (assets ÷ shareholders’ equity)
ROE = annual net profit ÷ shareholders’ equity
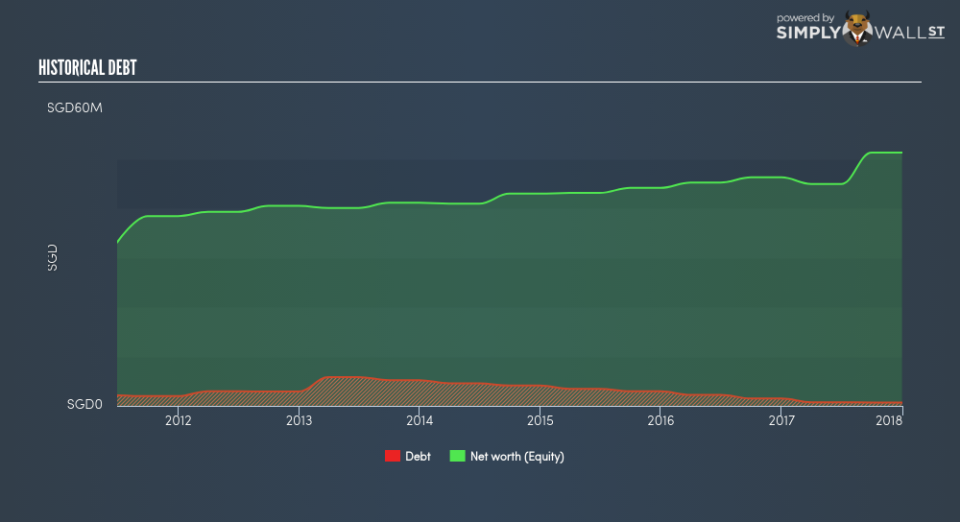
Essentially, profit margin shows how much money the company makes after paying for all its expenses. The other component, asset turnover, illustrates how much revenue LHT Holdings can make from its asset base. And finally, financial leverage is simply how much of assets are funded by equity, which exhibits how sustainable the company’s capital structure is. Since financial leverage can artificially inflate ROE, we need to look at how much debt LHT Holdings currently has. At 1.36%, LHT Holdings’s debt-to-equity ratio appears low and indicates the above-average ROE is generated from its capacity to increase profit without a large debt burden.
Next Steps:
While ROE is a relatively simple calculation, it can be broken down into different ratios, each telling a different story about the strengths and weaknesses of a company. LHT Holdings’s ROE is impressive relative to the industry average and also covers its cost of equity. Its high ROE is not likely to be driven by high debt. Therefore, investors may have more confidence in the sustainability of this level of returns going forward. ROE is a helpful signal, but it is definitely not sufficient on its own to make an investment decision.
For LHT Holdings, I’ve compiled three essential factors you should further examine:
Financial Health: Does it have a healthy balance sheet? Take a look at our free balance sheet analysis with six simple checks on key factors like leverage and risk.
Valuation: What is LHT Holdings worth today? Is the stock undervalued, even when its growth outlook is factored into its intrinsic value? The intrinsic value infographic in our free research report helps visualize whether LHT Holdings is currently mispriced by the market.
Other High-Growth Alternatives : Are there other high-growth stocks you could be holding instead of LHT Holdings? Explore our interactive list of stocks with large growth potential to get an idea of what else is out there you may be missing!
To help readers see pass the short term volatility of the financial market, we aim to bring you a long-term focused research analysis purely driven by fundamental data. Note that our analysis does not factor in the latest price sensitive company announcements.
The author is an independent contributor and at the time of publication had no position in the stocks mentioned.
