
 Yahoo Finance
 What To Know Before Buying StarHub Ltd (SGX:CC3) For Its Dividend

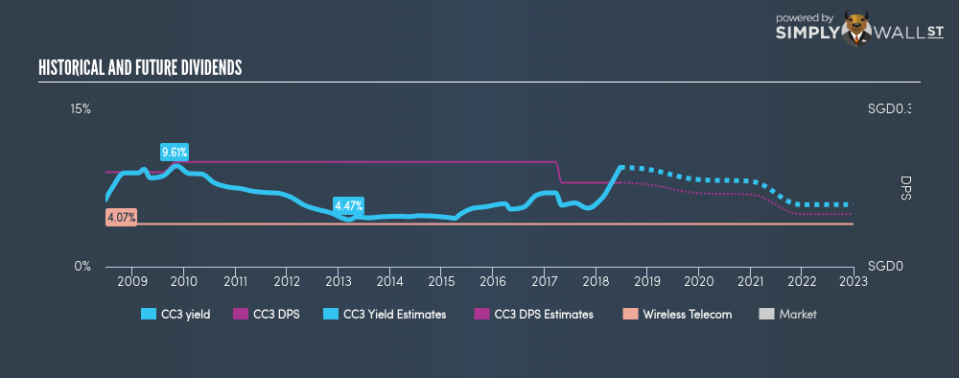
Dividends play an important role in compounding returns in the long run and end up forming a sizeable part of investment returns. Over the past 10 years, StarHub Ltd (SGX:CC3) has returned an average of 7.00% per year to shareholders in terms of dividend yield. Does StarHub tick all the boxes of a great dividend stock? Below, I’ll take you through my analysis. See our latest analysis for StarHub
5 questions to ask before buying a dividend stock
When researching a dividend stock, I always follow the following screening criteria:
Is its annual yield among the top 25% of dividend-paying companies?
Has its dividend been stable over the past (i.e. no missed payments or significant payout cuts)?
Has it increased its dividend per share amount over the past?
Can it afford to pay the current rate of dividends from its earnings?
Will it have the ability to keep paying its dividends going forward?
Does StarHub pass our checks?
StarHub has a trailing twelve-month payout ratio of 118.28%, meaning the dividend is not sufficiently covered by its earnings. Going forward, analysts expect CC3’s payout to remain around the same level at 128.92% of its earnings, which leads to a dividend yield of around 8.51%. Furthermore, EPS is forecasted to fall to SGD0.13 in the upcoming year.
If dividend is a key criteria in your investment consideration, then you need to make sure the dividend stock you’re eyeing out is reliable in its payments. CC3 investors will be well aware there has not been any increase in the dividend payments over the last 10 years, although the payments have at least been steady. However, income investors that value stability over growth may still find CC3 appealing.
In terms of its peers, StarHub generates a yield of 9.47%, which is high for Wireless Telecom stocks.
Next Steps:
If you are building an income portfolio, then StarHub is a complicated choice since it has some positive aspects as well as negative ones. However, if you are not strictly just a dividend investor, the stock could still offer some interesting investment opportunities. Given that this is purely a dividend analysis, you should always research extensively before deciding whether or not a stock is an appropriate investment for you. I always recommend analysing the company’s fundamentals and underlying business before making an investment decision. Below, I’ve compiled three relevant factors you should further examine:
Future Outlook: What are well-informed industry analysts predicting for CC3’s future growth? Take a look at our free research report of analyst consensus for CC3’s outlook.
Valuation: What is CC3 worth today? Even if the stock is a cash cow, it’s not worth an infinite price. The intrinsic value infographic in our free research report helps visualize whether CC3 is currently mispriced by the market.
Dividend Rockstars: Are there better dividend payers with stronger fundamentals out there? Check out our free list of these great stocks here.
To help readers see pass the short term volatility of the financial market, we aim to bring you a long-term focused research analysis purely driven by fundamental data. Note that our analysis does not factor in the latest price sensitive company announcements.
The author is an independent contributor and at the time of publication had no position in the stocks mentioned.
