
 Yahoo Finance
 Jones Lang LaSalle (JLL) Q2 FFO & Revenues Surpass Estimates

Jones Lang LaSalle Inc. JLL reported second-quarter 2022 adjusted earnings per share (EPS) of $4.48, beating the Zacks Consensus Estimate of $4.10. The reported figure increased 6.7% from the prior-year quarter’s $4.20.
Revenues in the quarter totaled $5.3 billion, surpassing the Zacks Consensus Estimate of $4.9 billion. It was 17.4% higher than the year-ago quarter’s tally.
JLL recorded revenue and fee revenue year-over-year growth of 21% and 23%, respectively, during the second quarter. Results reflect robust performance in the Capital Markets and Markets Advisory businesses. Moreover, annuity-based businesses under the Work Dynamics segment continued to furnish solid fee revenue growth.
However, shares of JLL lost 1.76% during Aug 3 trading session on the NYSE after the release of the second-quarter 2022 results.
The quarterly adjusted EBITDA margin, calculated on a fee-revenue basis, fell to 16.8% (USD) from 18.5% in 2021 due to a rise in compensation expenses, including higher commissions and increased headcount, T&E and marketing expenses, which more than offset the fee revenue growth.
Segment-Wise Performance
During the second quarter, the Market Advisory segment’s revenues and fee revenues came in at $1.1 billion and $855.8 million, respectively, reflecting an 18% and 20% (in USD) year-over-year jump. Revenues and fee revenue growth were driven by improvement in the Leasing line of business, which improved 24% (USD) year over year.
Revenues and fee revenues for the Capital Markets segment were $684.5 million and $660.7 million, respectively, both marking a 24% (in USD) year-over-year rise. The growth in fee revenues was broad-based, backed by higher debt advisory and investment sales.
JLL’s Work Dynamics segment reported revenues and fee revenues of $3.3 billion and $467 million, respectively, up 17% and 14% (in USD) year over year. The rise in revenues and fee growth was attributable to the commencement of Workplace Management services for new client acquisitions and expansion of existing global mandates, mainly in the United States and higher project demand under the Project Management line of business.
JLL Technologies segment reported revenues and fee revenues of $50.7 million and $48 million, respectively, rising 28% and 46% (in USD) from the prior-year quarter levels. This top-line growth included $8.3 million of incremental fee revenues from acquisitions closed during the second half of 2021. Backed by new customers and growth from existing customers in software and solutions offerings, organic fee revenues increased 22% year over year.
However, the revenues and fee revenues in the LaSalle segment fell 1.1% each (in USD) year over year to $114.5 million and $107.3 million, respectively. The rise in advisory fee, driven by strong capital raising along with a rise in fair value of assets under management over the trailing twelve months, was offset by the non-recurrence of the prior-year incentive fees associated with real estate dispositions on behalf of clients, mainly in the Asia Pacific, in the second quarter.
As of Jun 30, 2022, LaSalle had $82.1 billion of real estate assets under management (AUM), up 6% (USD) sequentially. The rise was fueled by an increase in acquisitions and net valuation, partially offset by dispositions, withdrawals and foreign currency decreases.
Balance Sheet
JLL exited second-quarter 2022 with cash and cash equivalents of $568.0 million, down from $575.8 million as of Mar 31, 2022.
As of Jun 30, 2022, the net leverage ratio was 1.0, up from 0.8 as of Mar 31, 2022, and 0.6 as of Jun 30, 2021. The corporate liquidity was $1.9 billion as of the same date.
During the second quarter, the company repurchased 1,397,915 shares for $297.7 million. Additionally, approximately $1.3 billion remained authorized for repurchase under the share repurchase program as of Jun 30, 2022.
JLL currently carries a Zacks Rank #4 (Sell).
You can see the complete list of today’s Zacks #1 Rank (Strong Buy) stocks here.
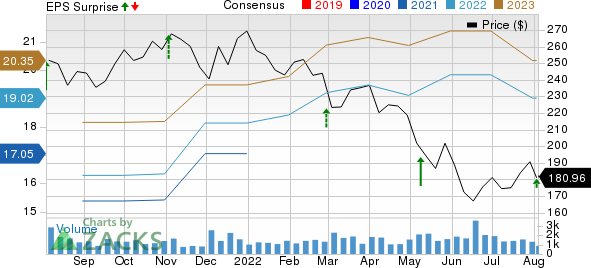
Jones Lang LaSalle Incorporated Price, Consensus and EPS Surprise
Jones Lang LaSalle Incorporated price-consensus-eps-surprise-chart | Jones Lang LaSalle Incorporated Quote
Performance of Other Real Estate Stocks
Colliers International Group’s CIGI second-quarter 2022 adjusted EPS of 1.84 cents outpaced the Zacks Consensus Estimate of $1.72. The figure increased 16.5% year over year.
CIGI’s quarterly revenues of $1.13 billion beat the Zacks Consensus Estimate of $1.04 billion. The figure indicated a rise of 19.2% year over year.
eXp World Holdings EXPI reported second-quarter 2022 EPS of 6 cents, lagging the Zacks Consensus Estimate of 17 cents. Moreover, the figure compared unfavorably from the year-ago quarter’s of 24 cents.
EXPI generated revenues of $1.4 billion, indicating an increase of 42% year over year. It also beat the Zacks Consensus Estimate of $1.2 billion.
Want the latest recommendations from Zacks Investment Research? Today, you can download 7 Best Stocks for the Next 30 Days. Click to get this free report
Jones Lang LaSalle Incorporated (JLL) : Free Stock Analysis Report
Colliers International Group Inc. (CIGI) : Free Stock Analysis Report
Exp World Holdings, Inc. (EXPI) : Free Stock Analysis Report
To read this article on Zacks.com click here.
Zacks Investment Research
