
 Yahoo Finance
 The J.M. Smucker (SJM) Q3 Earnings Beat, Sales Increase Y/Y
The J. M. Smucker Company SJM posted third-quarter fiscal 2023 results, with the bottom line declining year over year but surpassing the Zacks Consensus Estimate. The top line increased from the year-ago quarter’s level. Management updated its net sales and adjusted earnings per share (EPS) views for fiscal 2023.
Quarter in Detail
Adjusted earnings of $2.21 per share declined 5% year over year. However, the metric surpassed the Zacks Consensus Estimate of $2.13.
Net sales amounted to $2,216.3 million, which advanced 8% year over year. The Zacks Consensus Estimate for the top line was pegged at $2,222 million
Excluding non-comparable net sales related to divestitures and currency movements, net sales increased 11%. The uptick in comparable net sales can be attributed to the positive net price realization, mainly reflecting list price increases for U.S. Retail, International and Away from Home segments. However, the decline in volume/mix, mainly in the U.S. Retail Coffee segment, was a concern.
The gross profit grew 11% on the favorable net impact of increased net price realization and higher commodity and ingredient, manufacturing as well as packaging expenses, among others. These were partly compensated by reduced contributions from volume/mix and divested business. The adjusted gross profit increased 4%. The adjusted operating income dropped 5%.
The J. M. Smucker Company Price, Consensus and EPS Surprise
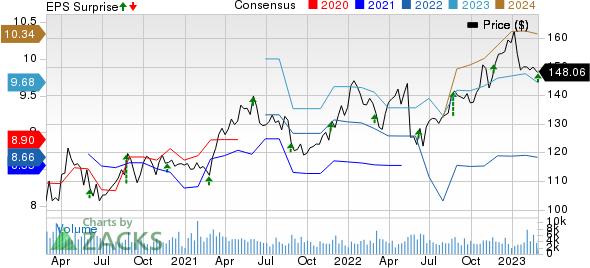
The J. M. Smucker Company price-consensus-eps-surprise-chart | The J. M. Smucker Company Quote
Segmental Performance
U.S. Retail Pet Foods: The segment’s sales jumped 9% to $758.6 million. Excluding non-comparable net sales associated with the private label dry pet food businesses’ divestiture, the metric rose 10%. The volume/mix had an adverse impact of 5 percentage-points, made up by the net price realization, which had a favorable 16-percentage point impact on net sales. The segment’s profit jumped 14% to $109 million.
U.S. Retail Coffee: Net sales increased 11% to $735.1 million. The volume/mix had a 8-percentage-point negative impact, and the net price realization boosted net sales by 19 percentage points. The segment’s profit moved down 4% to $204 million.
U.S. Retail Consumer Foods: Sales in the segment increased $1.1 million to $434.2 million. Excluding the impact of the natural beverage and grain businesses’ divestiture, net sales ascended by 9%. The net price realization had a 6-percentage point positive impact on sales. The volume/mix increased net sales by 3 percentage points. The segment’s profit tumbled 5% to $94.1 million.
International and Away From Home: Net sales advanced 9% to $288.4 million. Excluding the impact of the natural beverage and grain businesses’ divestiture and the negative impacts of currency movements, net sales escalated by 12%.
Excluding the impact of divestitures and currency headwinds, net sales rose 17% for the Away from Home division and 6% for the International division. The volume/mix had a 3-percentage-point negative effect, and the net price realization had a positive impact of 15 percentage points on overall net sales. The segment’s profit climbed 10% to $37.6 million.

Image Source: Zacks Investment Research
Financials
The J. M. Smucker exited the quarter with cash and cash equivalents of $104.2 million, long-term debt of $4,313.3 million and total shareholders’ equity of $8,335 million.
Cash flow provided by operating activities amounted to $584.6 million for the three months ended Jan 31, 2023. Free cash flow was $442.7 million in the quarter. Net debt repayments amounted to $303.4 million for the quarter.
Free cash flow and capital expenditures are likely to be $550 million each in fiscal 2023.
Fiscal 2023 Guidance
Management stated that the ongoing cost inflation, a volatile supply chain and a broader macroeconomic landscape continue to affect the company’s results and cause risks for fiscal 2023. The recent product recall is expected to impact financial results.
That said, The J.M. Smucker remains focused on actions like minimizing the impacts of cost inflation, product recall and other business hurdles.
For fiscal 2023, SJM anticipates net sales to rise 6% now, compared with the previous view of 5.5-6.5%. Excluding non-comparable sales related to the private label dry pet food and natural beverage and grain businesses’ divestitures, net sales are anticipated to improve nearly 8%.
The view reflects the positive impact of elevated net pricing to counter cost inflation in many categories, partly negated by an expected volume/mix effect of the price elasticity of demand and a 2% adverse impact related to the product recall and manufacturing downtime.
The adjusted EPS for fiscal 2023 is envisioned in the $8.55-$8.75 band, compared with the earlier $8.35-$8.75 band. The guidance includes an 80-cent impact of the product recall. The bottom-line view reflects the positive impact of pricing and share buybacks (of the prior year), more than negated by inflated costs, an expected volume/mix effect of the price elasticity of demand, an adverse impact of the product recall and elevated SD&A expenses.
The bottom-line view takes into account an adjusted gross profit margin of 33.5%. Also, the adjusted effective income tax rate is envisioned at 24.2%.
Shares of this Zacks Rank #3 (Hold) company have gained 4.2% in the past six months against the industry’s dip of 0.6%.
Some Top-Ranked Food Bets
Some top-ranked stocks are Conagra Brands CAG, Lamb Weston LW and Mondelez International, Inc. MDLZ.
Conagra, a consumer-packaged goods food company, currently sports a Zacks Rank #1 (Strong Buy). CAG has a trailing four-quarter earnings surprise of 8.9%, on average. You can see the complete list of today’s Zacks #1 Rank stocks here.
The Zacks Consensus Estimate for Conagra’s current fiscal-year sales and earnings suggests growth of 7.2% and 12.7%, respectively, from the corresponding year-ago reported figures.
Lamb Weston, which is a frozen potato product company, currently sports a Zacks Rank #1. LW has a trailing four-quarter earnings surprise of 52.6%, on average.
The Zacks Consensus Estimate for Lamb Weston’s current fiscal-year sales and earnings suggests an increase of 19.3% and 89.9%, respectively, from the year-ago reported number.
Mondelez International, which manufactures, markets, and sells snack food and beverage products, carries a Zacks Rank 2 (Buy). MDLZ has a trailing four-quarter earnings surprise of 7.5%, on average.
The Zacks Consensus Estimate for Mondelez’s current financial year sales and earnings suggests growth of 9% and 7.5%, respectively, from the corresponding year-ago reported figures.
Want the latest recommendations from Zacks Investment Research? Today, you can download 7 Best Stocks for the Next 30 Days. Click to get this free report
Conagra Brands (CAG) : Free Stock Analysis Report
The J. M. Smucker Company (SJM) : Free Stock Analysis Report
Mondelez International, Inc. (MDLZ) : Free Stock Analysis Report
Lamb Weston (LW) : Free Stock Analysis Report
